signal strength 1 of 5
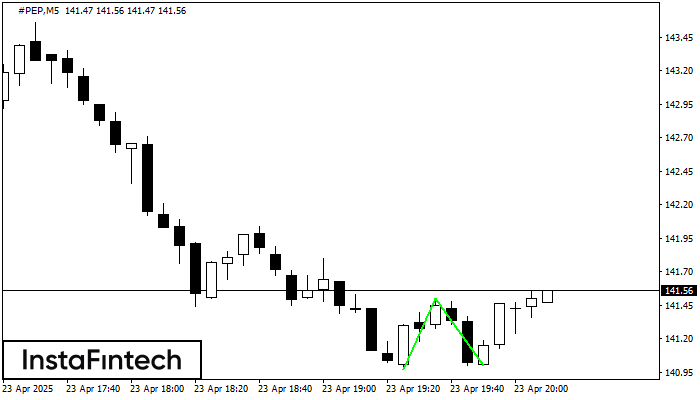
The Double Bottom pattern has been formed on #PEP M5. This formation signals a reversal of the trend from downwards to upwards. The signal is that a buy trade should be opened after the upper boundary of the pattern 141.50 is broken. The further movements will rely on the width of the current pattern 53 points.
The M5 and M15 time frames may have more false entry points.
- All
- Double Top
- Flag
- Head and Shoulders
- Pennant
- Rectangle
- Triangle
- Triple top
- All
- #AAPL
- #AMZN
- #Bitcoin
- #EBAY
- #FB
- #GOOG
- #INTC
- #KO
- #MA
- #MCD
- #MSFT
- #NTDOY
- #PEP
- #TSLA
- #TWTR
- AUDCAD
- AUDCHF
- AUDJPY
- AUDUSD
- EURCAD
- EURCHF
- EURGBP
- EURJPY
- EURNZD
- EURRUB
- EURUSD
- GBPAUD
- GBPCHF
- GBPJPY
- GBPUSD
- GOLD
- NZDCAD
- NZDCHF
- NZDJPY
- NZDUSD
- SILVER
- USDCAD
- USDCHF
- USDJPY
- USDRUB
- All
- M5
- M15
- M30
- H1
- D1
- All
- Buy
- Sale
- All
- 1
- 2
- 3
- 4
- 5

El patrón Doble Piso ha sido formado en #Bitcoin M5. Características: el nivel de soporte 105358.42; el nivel de resistencia 105551.46; el ancho del patrón 19304 puntos. Si el nivel
Los marcos de tiempo M5 y M15 pueden tener más puntos de entrada falsos.
Open chart in a new window
El patrón Doble Piso ha sido formado en #Bitcoin M5. Características: el nivel de soporte 105347.39; el nivel de resistencia 105744.30; el ancho del patrón 39691 puntos. Si el nivel
Los marcos de tiempo M5 y M15 pueden tener más puntos de entrada falsos.
Open chart in a new window
El patrón Triple Techo ha sido formado en el gráfico de #Bitcoin M15. Características del patrón: los límites tienen un ángulo ascendente, la línea inferior del patrón tiene coordenadas 105222.82/105606.00
Los marcos de tiempo M5 y M15 pueden tener más puntos de entrada falsos.
Open chart in a new window