


signal strength 1 of 5
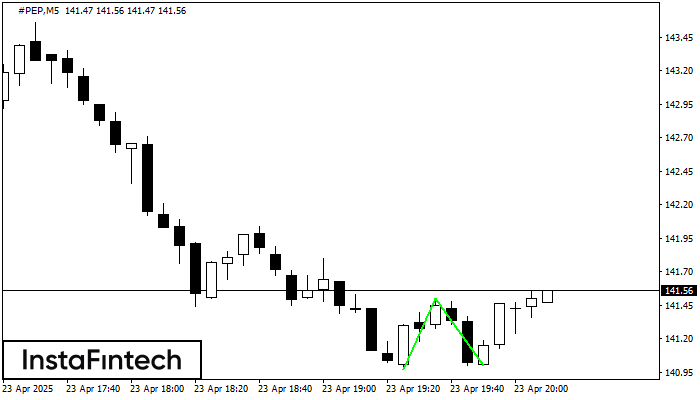
The Double Bottom pattern has been formed on #PEP M5. This formation signals a reversal of the trend from downwards to upwards. The signal is that a buy trade should be opened after the upper boundary of the pattern 141.50 is broken. The further movements will rely on the width of the current pattern 53 points.
The M5 and M15 time frames may have more false entry points.
আরও দেখুন
- All
- Double Top
- Flag
- Head and Shoulders
- Pennant
- Rectangle
- Triangle
- Triple top
- All
- #AAPL
- #AMZN
- #Bitcoin
- #EBAY
- #FB
- #GOOG
- #INTC
- #KO
- #MA
- #MCD
- #MSFT
- #NTDOY
- #PEP
- #TSLA
- #TWTR
- AUDCAD
- AUDCHF
- AUDJPY
- AUDUSD
- EURCAD
- EURCHF
- EURGBP
- EURJPY
- EURNZD
- EURRUB
- EURUSD
- GBPAUD
- GBPCHF
- GBPJPY
- GBPUSD
- GOLD
- NZDCAD
- NZDCHF
- NZDJPY
- NZDUSD
- SILVER
- USDCAD
- USDCHF
- USDJPY
- USDRUB
- All
- M5
- M15
- M30
- H1
- D1
- All
- Buy
- Sale
- All
- 1
- 2
- 3
- 4
- 5

The Triple Top pattern has formed on the chart of the GOLD M5 trading instrument. It is a reversal pattern featuring the following characteristics: resistance level 4, support level -193
The M5 and M15 time frames may have more false entry points.
Open chart in a new window
According to the chart of M5, #AMZN produced the pattern termed the Inverse Head and Shoulder. The Head is fixed at 201.64 while the median line of the Neck
The M5 and M15 time frames may have more false entry points.
Open chart in a new window
According to the chart of M5, GBPAUD formed the Bearish Rectangle which is a pattern of a trend continuation. The pattern is contained within the following borders: lower border 2.0897
The M5 and M15 time frames may have more false entry points.
Open chart in a new window


