


signal strength 1 of 5
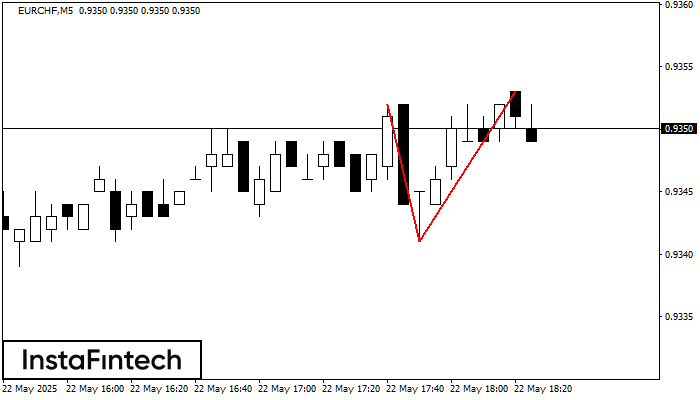
The Double Top reversal pattern has been formed on EURCHF M5. Characteristics: the upper boundary 0.9352; the lower boundary 0.9341; the width of the pattern is 12 points. Sell trades are better to be opened below the lower boundary 0.9341 with a possible movements towards the 0.9326 level.
The M5 and M15 time frames may have more false entry points.
See Also
- All
- Double Top
- Flag
- Head and Shoulders
- Pennant
- Rectangle
- Triangle
- Triple top
- All
- #AAPL
- #AMZN
- #Bitcoin
- #EBAY
- #FB
- #GOOG
- #INTC
- #KO
- #MA
- #MCD
- #MSFT
- #NTDOY
- #PEP
- #TSLA
- #TWTR
- AUDCAD
- AUDCHF
- AUDJPY
- AUDUSD
- EURCAD
- EURCHF
- EURGBP
- EURJPY
- EURNZD
- EURRUB
- EURUSD
- GBPAUD
- GBPCHF
- GBPJPY
- GBPUSD
- GOLD
- NZDCAD
- NZDCHF
- NZDJPY
- NZDUSD
- SILVER
- USDCAD
- USDCHF
- USDJPY
- USDRUB
- All
- M5
- M15
- M30
- H1
- D1
- All
- Buy
- Sale
- All
- 1
- 2
- 3
- 4
- 5
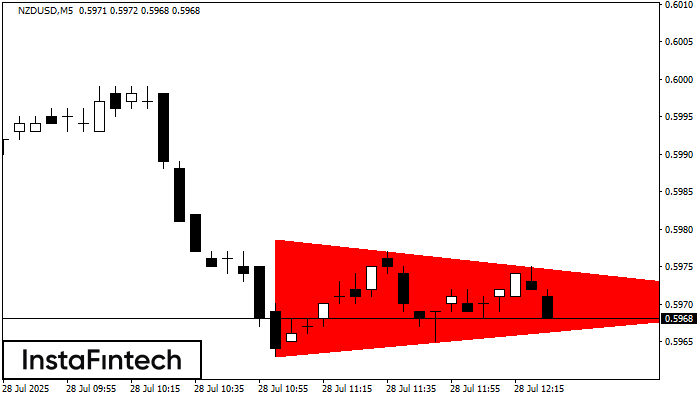
According to the chart of M5, NZDUSD formed the Bearish Symmetrical Triangle pattern. Trading recommendations: A breach of the lower border 0.5963 is likely to encourage a continuation
The M5 and M15 time frames may have more false entry points.
Open chart in a new window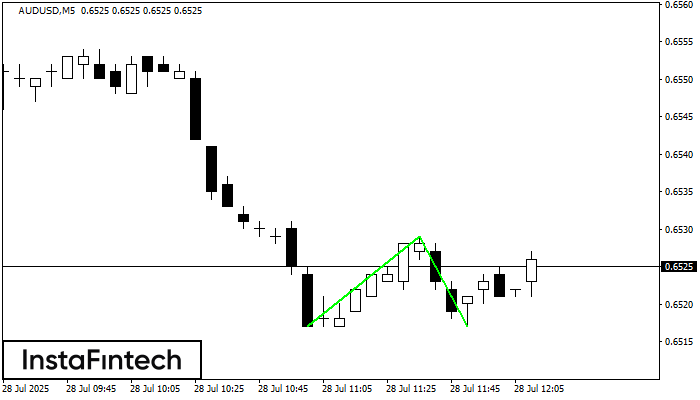
The Double Bottom pattern has been formed on AUDUSD M5. This formation signals a reversal of the trend from downwards to upwards. The signal is that a buy trade should
The M5 and M15 time frames may have more false entry points.
Open chart in a new window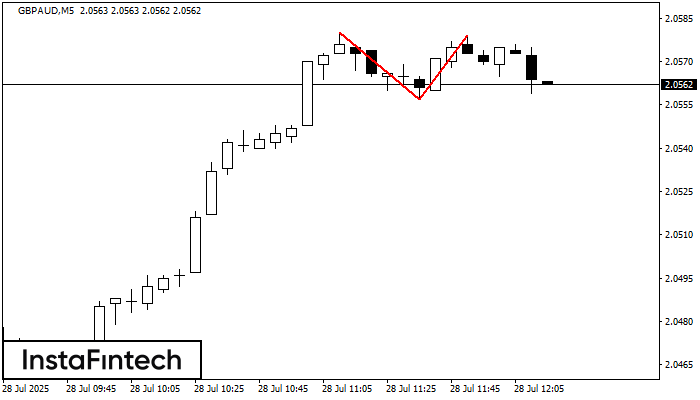
The Double Top pattern has been formed on GBPAUD M5. It signals that the trend has been changed from upwards to downwards. Probably, if the base of the pattern 2.0557
The M5 and M15 time frames may have more false entry points.
Open chart in a new window


