


signal strength 1 of 5
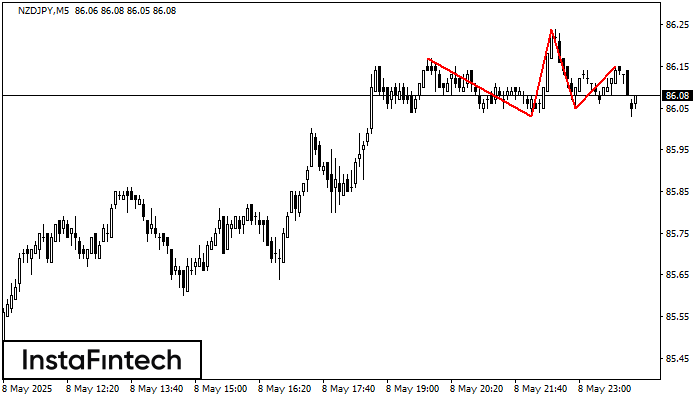
The technical pattern called Head and Shoulders has appeared on the chart of NZDJPY M5. There are weighty reasons to suggest that the price will surpass the Neckline 86.03/86.05 after the right shoulder has been formed. So, the trend is set to change with the price heading for 85.90.
The M5 and M15 time frames may have more false entry points.
- All
- Double Top
- Flag
- Head and Shoulders
- Pennant
- Rectangle
- Triangle
- Triple top
- All
- #AAPL
- #AMZN
- #Bitcoin
- #EBAY
- #FB
- #GOOG
- #INTC
- #KO
- #MA
- #MCD
- #MSFT
- #NTDOY
- #PEP
- #TSLA
- #TWTR
- AUDCAD
- AUDCHF
- AUDJPY
- AUDUSD
- EURCAD
- EURCHF
- EURGBP
- EURJPY
- EURNZD
- EURRUB
- EURUSD
- GBPAUD
- GBPCHF
- GBPJPY
- GBPUSD
- GOLD
- NZDCAD
- NZDCHF
- NZDJPY
- NZDUSD
- SILVER
- USDCAD
- USDCHF
- USDJPY
- USDRUB
- All
- M5
- M15
- M30
- H1
- D1
- All
- Buy
- Sale
- All
- 1
- 2
- 3
- 4
- 5
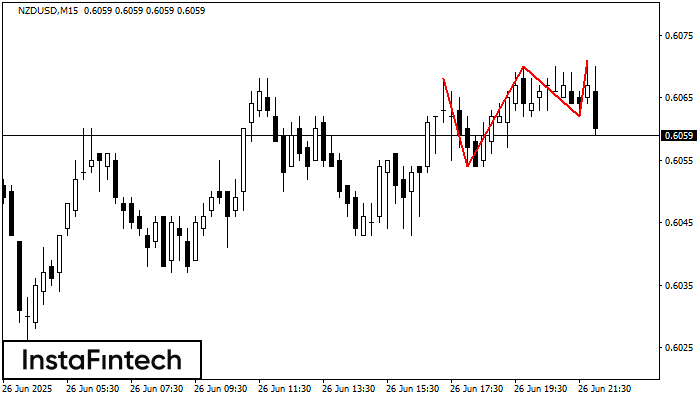
The Triple Top pattern has formed on the chart of the NZDUSD M15. Features of the pattern: borders have an ascending angle; the lower line of the pattern
The M5 and M15 time frames may have more false entry points.
Open chart in a new window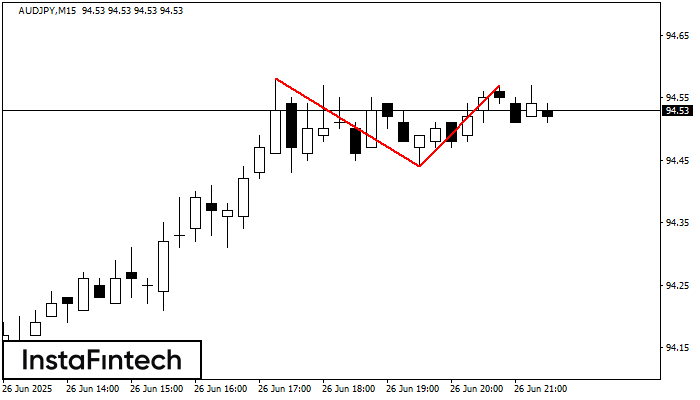
The Double Top reversal pattern has been formed on AUDJPY M15. Characteristics: the upper boundary 94.58; the lower boundary 94.44; the width of the pattern is 13 points. Sell trades
The M5 and M15 time frames may have more false entry points.
Open chart in a new window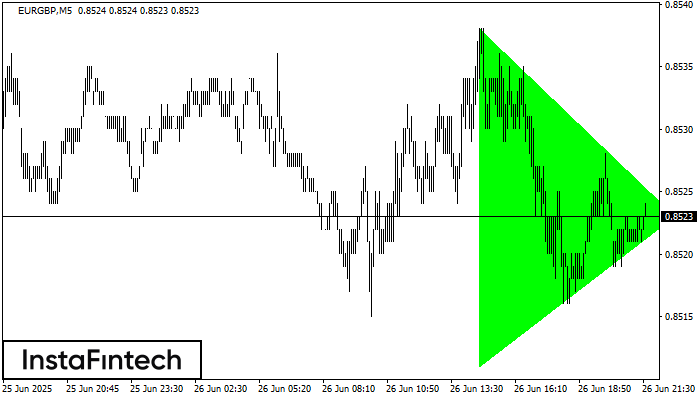
According to the chart of M5, EURGBP formed the Bullish Symmetrical Triangle pattern. The lower border of the pattern touches the coordinates 0.8511/0.8523 whereas the upper border goes across 0.8538/0.8523
The M5 and M15 time frames may have more false entry points.
Open chart in a new window


