


signal strength 1 of 5
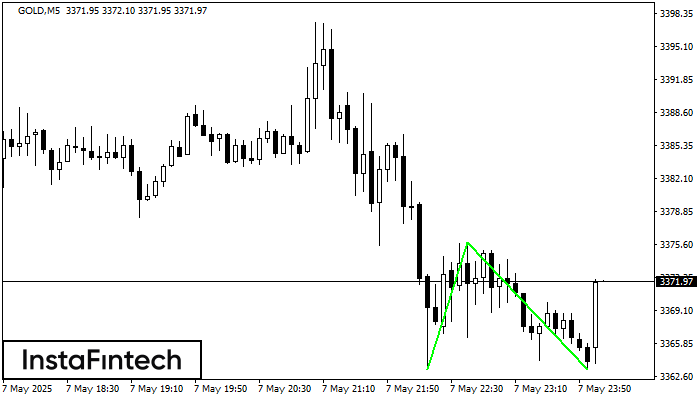
The Double Bottom pattern has been formed on GOLD M5; the upper boundary is 3375.87; the lower boundary is 3363.32. The width of the pattern is 1258 points. In case of a break of the upper boundary 3375.87, a change in the trend can be predicted where the width of the pattern will coincide with the distance to a possible take profit level.
The M5 and M15 time frames may have more false entry points.
See Also
- All
- Double Top
- Flag
- Head and Shoulders
- Pennant
- Rectangle
- Triangle
- Triple top
- All
- #AAPL
- #AMZN
- #Bitcoin
- #EBAY
- #FB
- #GOOG
- #INTC
- #KO
- #MA
- #MCD
- #MSFT
- #NTDOY
- #PEP
- #TSLA
- #TWTR
- AUDCAD
- AUDCHF
- AUDJPY
- AUDUSD
- EURCAD
- EURCHF
- EURGBP
- EURJPY
- EURNZD
- EURRUB
- EURUSD
- GBPAUD
- GBPCHF
- GBPJPY
- GBPUSD
- GOLD
- NZDCAD
- NZDCHF
- NZDJPY
- NZDUSD
- SILVER
- USDCAD
- USDCHF
- USDJPY
- USDRUB
- All
- M5
- M15
- M30
- H1
- D1
- All
- Buy
- Sale
- All
- 1
- 2
- 3
- 4
- 5
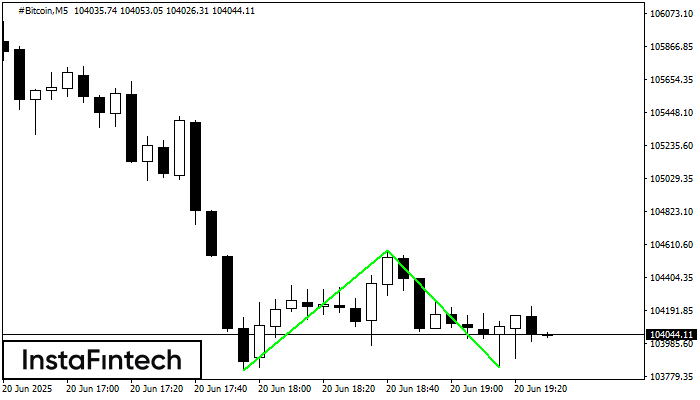
El patrón Doble Piso ha sido formado en #Bitcoin M5; el límite superior es 104573.10; el límite inferior es 103835.88. El ancho del patrón es 75721 puntos. En caso
Los marcos de tiempo M5 y M15 pueden tener más puntos de entrada falsos.
Open chart in a new window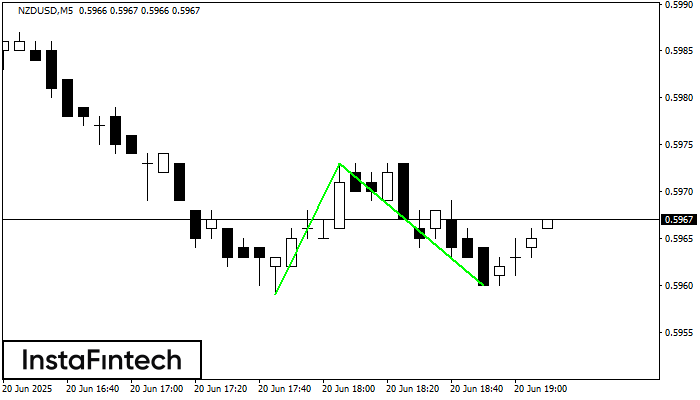
El patrón Doble Piso ha sido formado en NZDUSD M5. Características: el nivel de soporte 0.5959; el nivel de resistencia 0.5973; el ancho del patrón 14 puntos. Si el nivel
Los marcos de tiempo M5 y M15 pueden tener más puntos de entrada falsos.
Open chart in a new window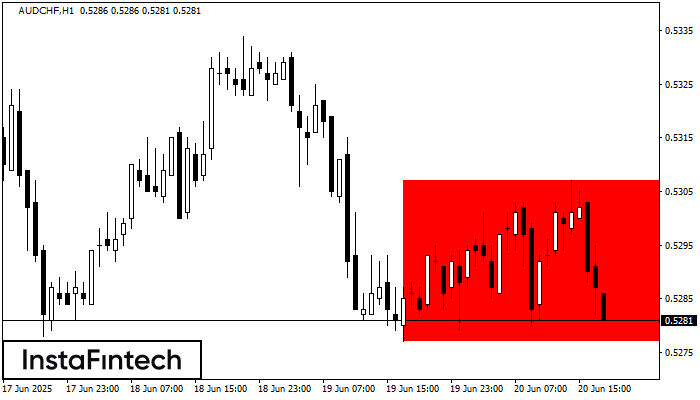
Según el gráfico de H1, AUDCHF formó el Rectángulo Bajista. El patrón indica la continuación de una tendencia. El límite superior es 0.5307, el límite inferior es 0.5277. La señal
Open chart in a new window


