


signal strength 2 of 5
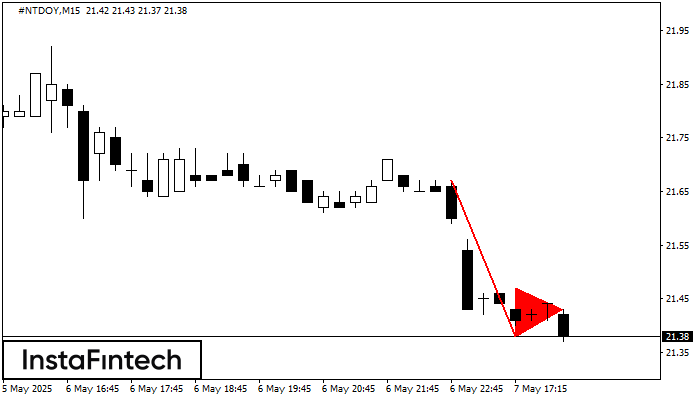
The Bearish pennant pattern has formed on the #NTDOY M15 chart. This pattern type is characterized by a slight slowdown after which the price will move in the direction of the original trend. In case the price fixes below the pattern’s low of 21.38, a trader will be able to successfully enter the sell position.
The M5 and M15 time frames may have more false entry points.
See Also
- All
- Double Top
- Flag
- Head and Shoulders
- Pennant
- Rectangle
- Triangle
- Triple top
- All
- #AAPL
- #AMZN
- #Bitcoin
- #EBAY
- #FB
- #GOOG
- #INTC
- #KO
- #MA
- #MCD
- #MSFT
- #NTDOY
- #PEP
- #TSLA
- #TWTR
- AUDCAD
- AUDCHF
- AUDJPY
- AUDUSD
- EURCAD
- EURCHF
- EURGBP
- EURJPY
- EURNZD
- EURRUB
- EURUSD
- GBPAUD
- GBPCHF
- GBPJPY
- GBPUSD
- GOLD
- NZDCAD
- NZDCHF
- NZDJPY
- NZDUSD
- SILVER
- USDCAD
- USDCHF
- USDJPY
- USDRUB
- All
- M5
- M15
- M30
- H1
- D1
- All
- Buy
- Sale
- All
- 1
- 2
- 3
- 4
- 5
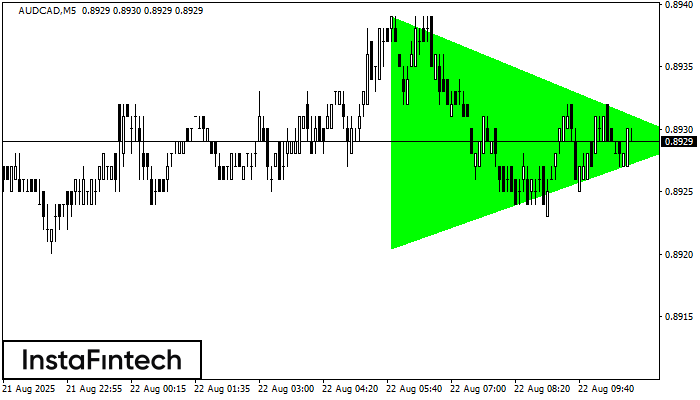
Según el gráfico de M5, el AUDCAD formó el patrón Triángulo Simétrico Alcista. El límite inferior del patrón toca las coordenadas 0.8920/0.8929 donde el límite superior cruza 0.8939/0.8929
Los marcos de tiempo M5 y M15 pueden tener más puntos de entrada falsos.
Open chart in a new window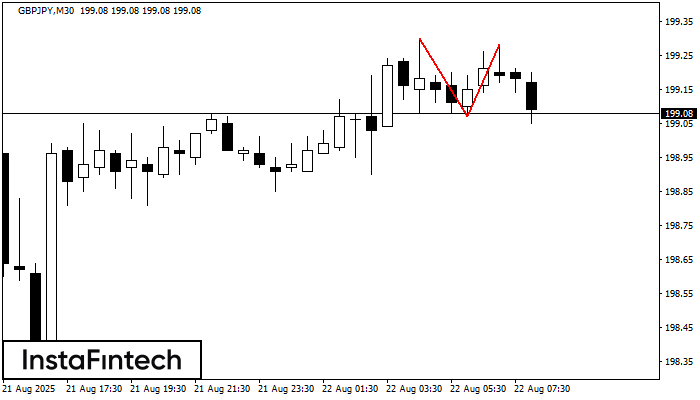
El patrón de reversión Doble Techo ha sido formado en GBPJPY M30. Características: el límite superior 199.30; el límite inferior 199.07; el ancho del patrón es 21 puntos. Es mejor
Open chart in a new window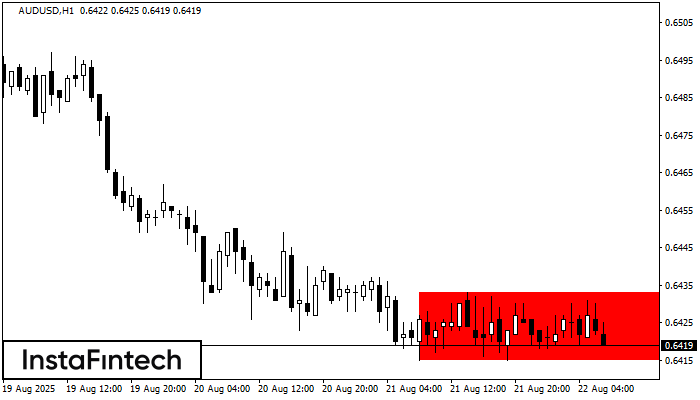
Según el gráfico de H1, AUDUSD formó el Rectángulo Bajista. El patrón indica la continuación de una tendencia. El límite superior es 0.6433, el límite inferior es 0.6415. La señal
Open chart in a new window


