

signal strength 4 of 5

The Bearish Flag pattern has been formed on the chart NZDCAD H1 which signals that the downward trend will continue. If the price breaks below the low at 0.8194, then it is most likely to move further downwards. The price will likely move by the number of points which equals the length of the flag pole (20 points).
See Also
- All
- Double Top
- Flag
- Head and Shoulders
- Pennant
- Rectangle
- Triangle
- Triple top
- All
- #AAPL
- #AMZN
- #Bitcoin
- #EBAY
- #FB
- #GOOG
- #INTC
- #KO
- #MA
- #MCD
- #MSFT
- #NTDOY
- #PEP
- #TSLA
- #TWTR
- AUDCAD
- AUDCHF
- AUDJPY
- AUDUSD
- EURCAD
- EURCHF
- EURGBP
- EURJPY
- EURNZD
- EURRUB
- EURUSD
- GBPAUD
- GBPCHF
- GBPJPY
- GBPUSD
- GOLD
- NZDCAD
- NZDCHF
- NZDJPY
- NZDUSD
- SILVER
- USDCAD
- USDCHF
- USDJPY
- USDRUB
- All
- M5
- M15
- M30
- H1
- D1
- All
- Buy
- Sale
- All
- 1
- 2
- 3
- 4
- 5
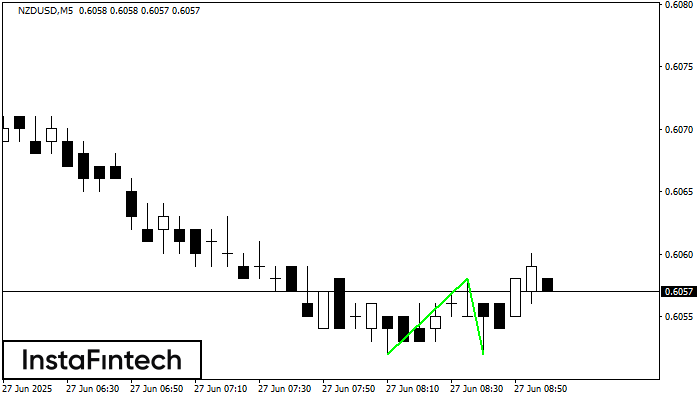
The Double Bottom pattern has been formed on NZDUSD M5. Characteristics: the support level 0.6052; the resistance level 0.6058; the width of the pattern 6 points. If the resistance level
The M5 and M15 time frames may have more false entry points.
Open chart in a new window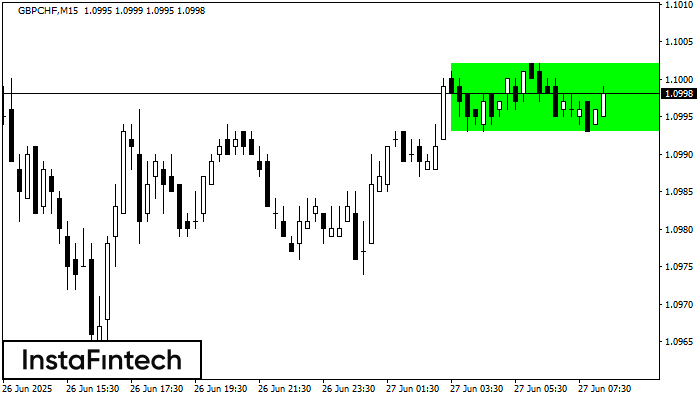
According to the chart of M15, GBPCHF formed the Bullish Rectangle. This type of a pattern indicates a trend continuation. It consists of two levels: resistance 1.1002 and support 1.0993
The M5 and M15 time frames may have more false entry points.
Open chart in a new window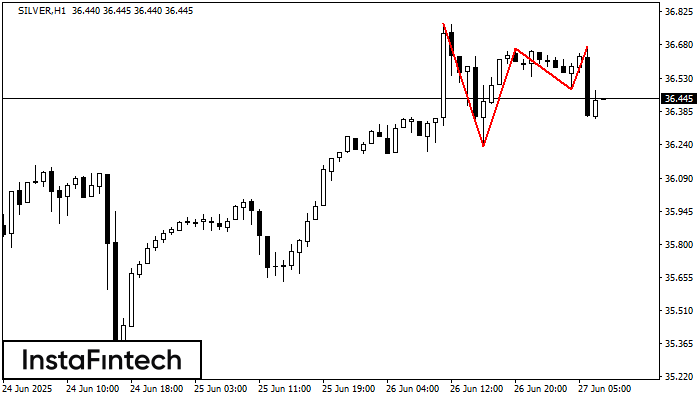
On the chart of the SILVER H1 trading instrument, the Triple Top pattern that signals a trend change has formed. It is possible that after formation of the third peak
Open chart in a new window


