


signal strength 3 of 5
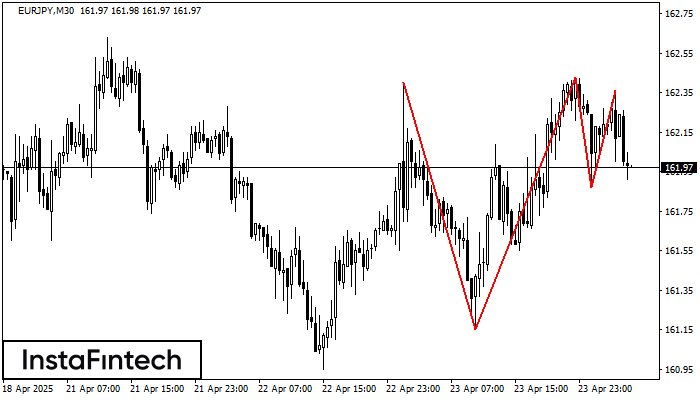
The Triple Top pattern has formed on the chart of the EURJPY M30. Features of the pattern: borders have an ascending angle; the lower line of the pattern has the coordinates 161.15/161.87 with the upper limit 162.40/162.36; the projection of the width is 125 points. The formation of the Triple Top figure most likely indicates a change in the trend from upward to downward. This means that in the event of a breakdown of the support level of 161.15, the price is most likely to continue the downward movement.
See Also
- All
- Double Top
- Flag
- Head and Shoulders
- Pennant
- Rectangle
- Triangle
- Triple top
- All
- #AAPL
- #AMZN
- #Bitcoin
- #EBAY
- #FB
- #GOOG
- #INTC
- #KO
- #MA
- #MCD
- #MSFT
- #NTDOY
- #PEP
- #TSLA
- #TWTR
- AUDCAD
- AUDCHF
- AUDJPY
- AUDUSD
- EURCAD
- EURCHF
- EURGBP
- EURJPY
- EURNZD
- EURRUB
- EURUSD
- GBPAUD
- GBPCHF
- GBPJPY
- GBPUSD
- GOLD
- NZDCAD
- NZDCHF
- NZDJPY
- NZDUSD
- SILVER
- USDCAD
- USDCHF
- USDJPY
- USDRUB
- All
- M5
- M15
- M30
- H1
- D1
- All
- Buy
- Sale
- All
- 1
- 2
- 3
- 4
- 5
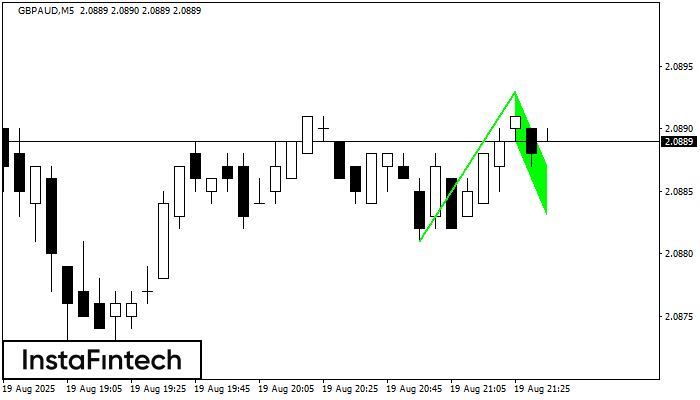
The Bullish Flag pattern has been formed on GBPAUD at M5. The lower boundary of the pattern is located at 2.0889/2.0883, while the higher boundary lies at 2.0893/2.0887. The projection
The M5 and M15 time frames may have more false entry points.
Open chart in a new window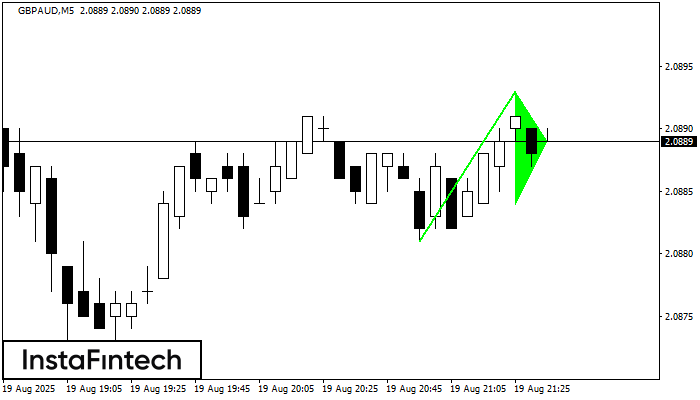
The Bullish pennant pattern is formed on the GBPAUD M5 chart. It is a type of the continuation pattern. Supposedly, in case the price is fixed above the pennant’s high
The M5 and M15 time frames may have more false entry points.
Open chart in a new window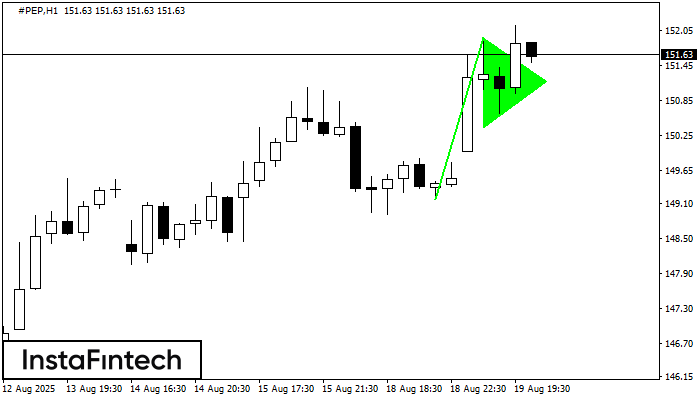
The Bullish pennant signal – Trading instrument #PEP H1, continuation pattern. Forecast: it is possible to set up a buy position above the pattern’s high of 151.93, with the prospect
Open chart in a new window


