


signal strength 1 of 5
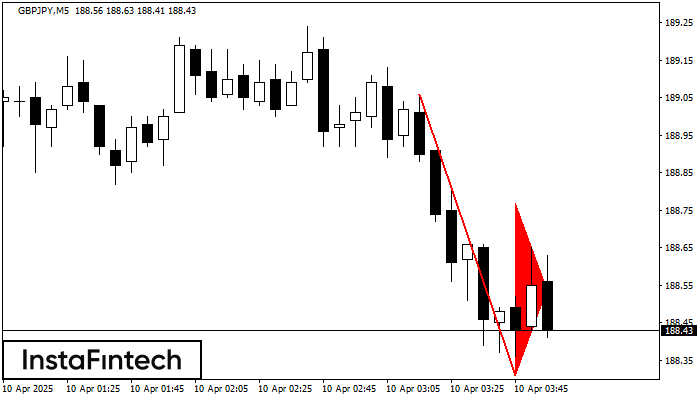
The Bearish pennant pattern has formed on the GBPJPY M5 chart. It signals potential continuation of the existing trend. Specifications: the pattern’s bottom has the coordinate of 188.31; the projection of the flagpole height is equal to 75 pips. In case the price breaks out the pattern’s bottom of 188.31, the downtrend is expected to continue for further level 188.16.
The M5 and M15 time frames may have more false entry points.
See Also
- All
- Double Top
- Flag
- Head and Shoulders
- Pennant
- Rectangle
- Triangle
- Triple top
- All
- #AAPL
- #AMZN
- #Bitcoin
- #EBAY
- #FB
- #GOOG
- #INTC
- #KO
- #MA
- #MCD
- #MSFT
- #NTDOY
- #PEP
- #TSLA
- #TWTR
- AUDCAD
- AUDCHF
- AUDJPY
- AUDUSD
- EURCAD
- EURCHF
- EURGBP
- EURJPY
- EURNZD
- EURRUB
- EURUSD
- GBPAUD
- GBPCHF
- GBPJPY
- GBPUSD
- GOLD
- NZDCAD
- NZDCHF
- NZDJPY
- NZDUSD
- SILVER
- USDCAD
- USDCHF
- USDJPY
- USDRUB
- All
- M5
- M15
- M30
- H1
- D1
- All
- Buy
- Sale
- All
- 1
- 2
- 3
- 4
- 5
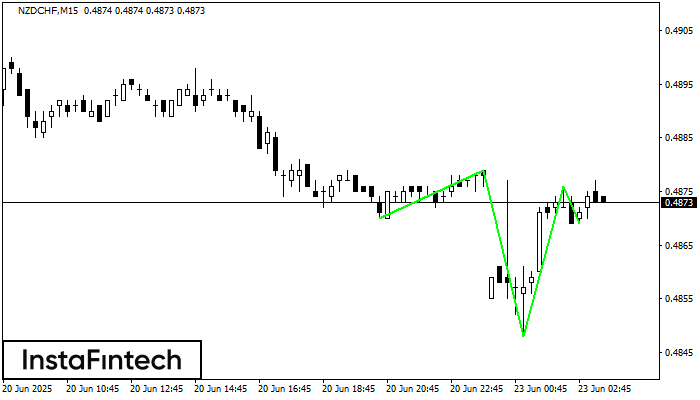
According to the chart of M15, NZDCHF formed the Inverse Head and Shoulder pattern. The Head’s top is set at 0.4876 while the median line of the Neck is found
The M5 and M15 time frames may have more false entry points.
Open chart in a new window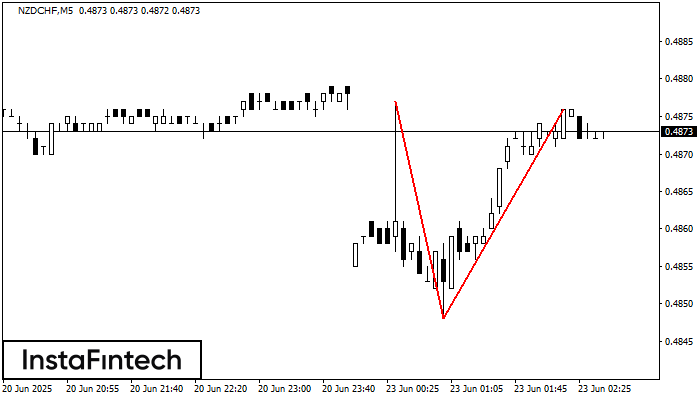
The Double Top pattern has been formed on NZDCHF M5. It signals that the trend has been changed from upwards to downwards. Probably, if the base of the pattern 0.4848
The M5 and M15 time frames may have more false entry points.
Open chart in a new window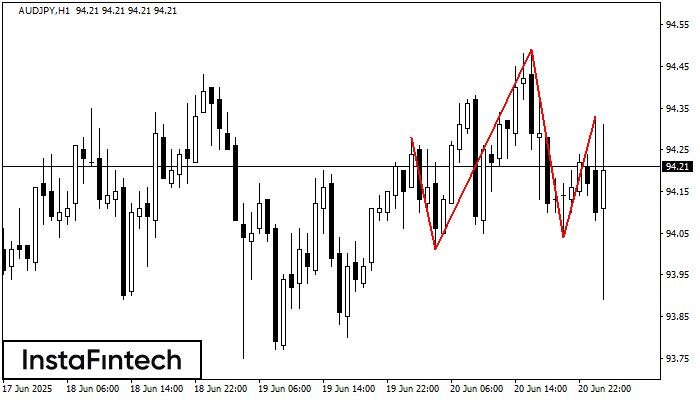
The AUDJPY H1 formed the Head and Shoulders pattern with the following features: The Head’s top is at 94.49, the Neckline and the upward angle are at 94.01/94.04. The formation
Open chart in a new window


