


signal strength 1 of 5
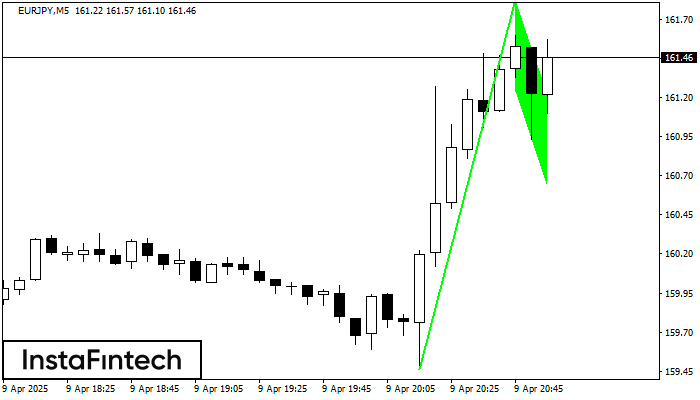
The Bullish Flag pattern has been formed on EURJPY at M5. The lower boundary of the pattern is located at 161.24/160.64, while the higher boundary lies at 161.82/161.22. The projection of the flagpole is 236 points. This formation signals that the upward trend is most likely to continue. Therefore, if the level of 161.82 is broken, the price will move further upwards.
The M5 and M15 time frames may have more false entry points.
- All
- Double Top
- Flag
- Head and Shoulders
- Pennant
- Rectangle
- Triangle
- Triple top
- All
- #AAPL
- #AMZN
- #Bitcoin
- #EBAY
- #FB
- #GOOG
- #INTC
- #KO
- #MA
- #MCD
- #MSFT
- #NTDOY
- #PEP
- #TSLA
- #TWTR
- AUDCAD
- AUDCHF
- AUDJPY
- AUDUSD
- EURCAD
- EURCHF
- EURGBP
- EURJPY
- EURNZD
- EURRUB
- EURUSD
- GBPAUD
- GBPCHF
- GBPJPY
- GBPUSD
- GOLD
- NZDCAD
- NZDCHF
- NZDJPY
- NZDUSD
- SILVER
- USDCAD
- USDCHF
- USDJPY
- USDRUB
- All
- M5
- M15
- M30
- H1
- D1
- All
- Buy
- Sale
- All
- 1
- 2
- 3
- 4
- 5
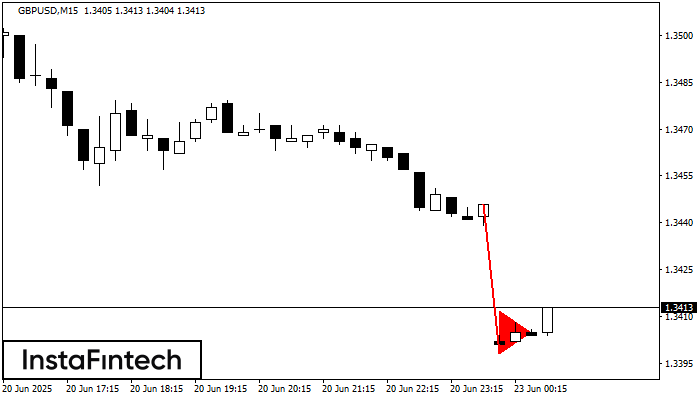
El patrón Banderín bajista se ha formado en el gráfico GBPUSD M15. El patrón señala la continuación de la tendencia bajista en caso de que se rompa el mínimo
Los marcos de tiempo M5 y M15 pueden tener más puntos de entrada falsos.
Open chart in a new window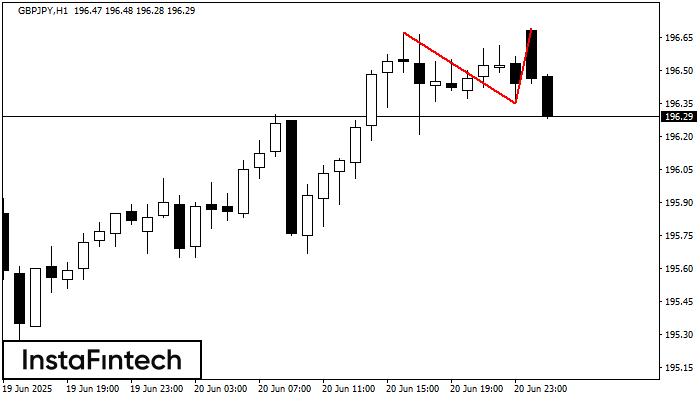
En el gráfico de GBPJPY H1 el patrón de reversión Doble Techo ha sido formado. Características: límite superior 196.69; límite inferior 196.35; el ancho del patrón 34 puntos. La señal
Open chart in a new window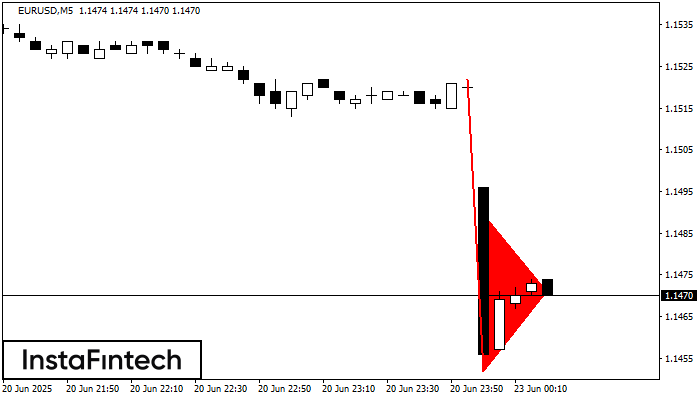
El patrón Banderín bajista se ha formado en el gráfico EURUSD M5. Este tipo de patrón se caracteriza por una ligera disminución después de lo cual el precio se moverá
Los marcos de tiempo M5 y M15 pueden tener más puntos de entrada falsos.
Open chart in a new window


