signal strength 2 of 5

According to the chart of M15, NZDJPY formed the Bearish Symmetrical Triangle pattern. Description: The lower border is 79.77/80.40 and upper border is 81.02/80.40. The pattern width is measured on the chart at -125 pips. The formation of the Bearish Symmetrical Triangle pattern evidently signals a continuation of the downward trend. In other words, if the scenario comes true and NZDJPY breaches the lower border, the price could continue its move toward 80.18.
The M5 and M15 time frames may have more false entry points.
- All
- Double Top
- Flag
- Head and Shoulders
- Pennant
- Rectangle
- Triangle
- Triple top
- All
- #AAPL
- #AMZN
- #Bitcoin
- #EBAY
- #FB
- #GOOG
- #INTC
- #KO
- #MA
- #MCD
- #MSFT
- #NTDOY
- #PEP
- #TSLA
- #TWTR
- AUDCAD
- AUDCHF
- AUDJPY
- AUDUSD
- EURCAD
- EURCHF
- EURGBP
- EURJPY
- EURNZD
- EURRUB
- EURUSD
- GBPAUD
- GBPCHF
- GBPJPY
- GBPUSD
- GOLD
- NZDCAD
- NZDCHF
- NZDJPY
- NZDUSD
- SILVER
- USDCAD
- USDCHF
- USDJPY
- USDRUB
- All
- M5
- M15
- M30
- H1
- D1
- All
- Buy
- Sale
- All
- 1
- 2
- 3
- 4
- 5
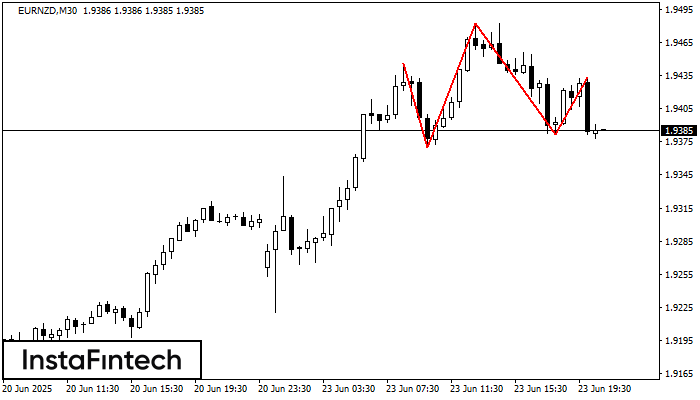
Según el gráfico de M30, EURNZD formó el patrón. El techo de la Cabeza está establecido en 1.9482 mientras la línea media del Cuello se encuentra en 1.9370/1.9382. La formación
Open chart in a new window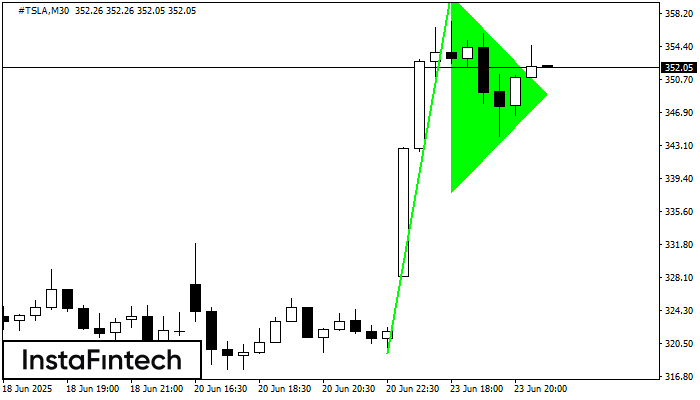
El patrón Banderín alcista está formado en el gráfico #TSLA M30. Este es un tipo de patrón de continuación. Supuestamente, en caso de que el precio se fije por encima
Open chart in a new window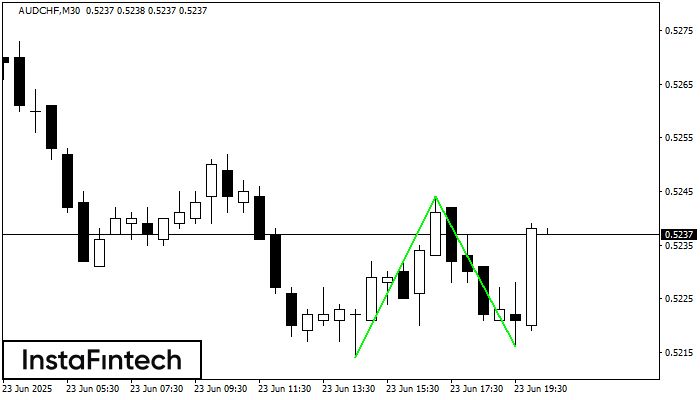
El patrón Doble Piso ha sido formado en AUDCHF M30. Características: el nivel de soporte 0.5214; el nivel de resistencia 0.5244; el ancho del patrón 30 puntos. Si el nivel
Open chart in a new window