


signal strength 2 of 5

The Bearish pennant pattern has formed on the AUDUSD M15 chart. It signals potential continuation of the existing trend. Specifications: the pattern’s bottom has the coordinate of 0.6272; the projection of the flagpole height is equal to 19 pips. In case the price breaks out the pattern’s bottom of 0.6272, the downtrend is expected to continue for further level 0.6249.
The M5 and M15 time frames may have more false entry points.
See Also
- All
- Double Top
- Flag
- Head and Shoulders
- Pennant
- Rectangle
- Triangle
- Triple top
- All
- #AAPL
- #AMZN
- #Bitcoin
- #EBAY
- #FB
- #GOOG
- #INTC
- #KO
- #MA
- #MCD
- #MSFT
- #NTDOY
- #PEP
- #TSLA
- #TWTR
- AUDCAD
- AUDCHF
- AUDJPY
- AUDUSD
- EURCAD
- EURCHF
- EURGBP
- EURJPY
- EURNZD
- EURRUB
- EURUSD
- GBPAUD
- GBPCHF
- GBPJPY
- GBPUSD
- GOLD
- NZDCAD
- NZDCHF
- NZDJPY
- NZDUSD
- SILVER
- USDCAD
- USDCHF
- USDJPY
- USDRUB
- All
- M5
- M15
- M30
- H1
- D1
- All
- Buy
- Sale
- All
- 1
- 2
- 3
- 4
- 5
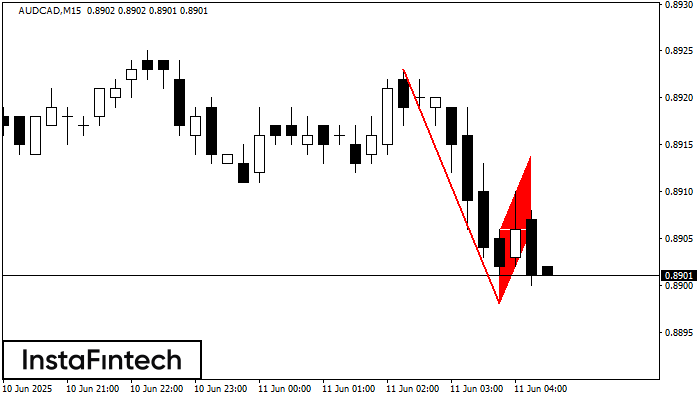
The Bearish Flag pattern has been formed on AUDCAD at M15. The lower boundary of the pattern is located at 0.8898/0.8906 while the upper boundary lies at 0.8906/0.8914. The projection
The M5 and M15 time frames may have more false entry points.
Open chart in a new window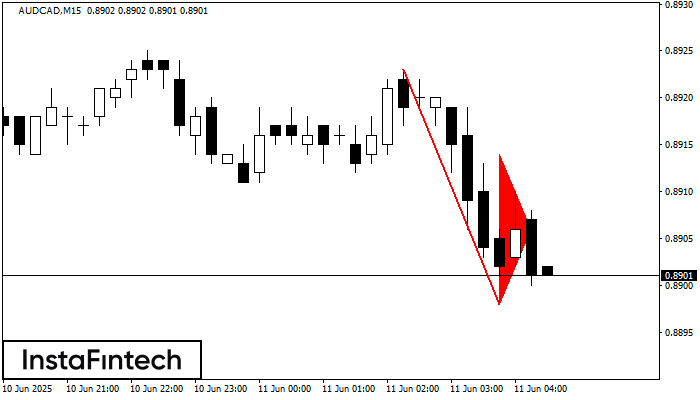
The Bearish pennant pattern has formed on the AUDCAD M15 chart. The pattern signals continuation of the downtrend in case the pennant’s low of 0.8898 is broken through. Recommendations: Place
The M5 and M15 time frames may have more false entry points.
Open chart in a new window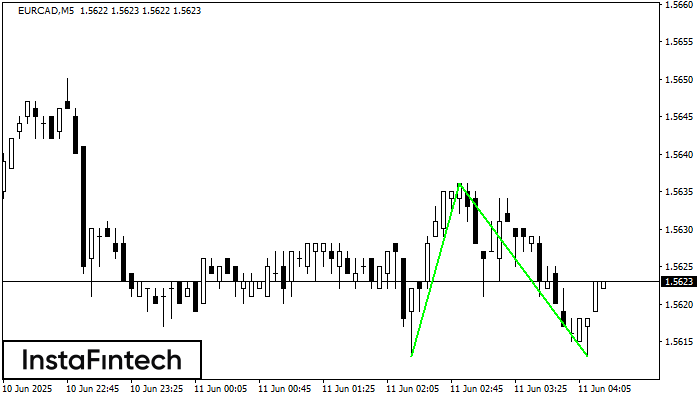
The Double Bottom pattern has been formed on EURCAD M5. Characteristics: the support level 1.5613; the resistance level 1.5636; the width of the pattern 23 points. If the resistance level
The M5 and M15 time frames may have more false entry points.
Open chart in a new window


