signal strength 3 of 5
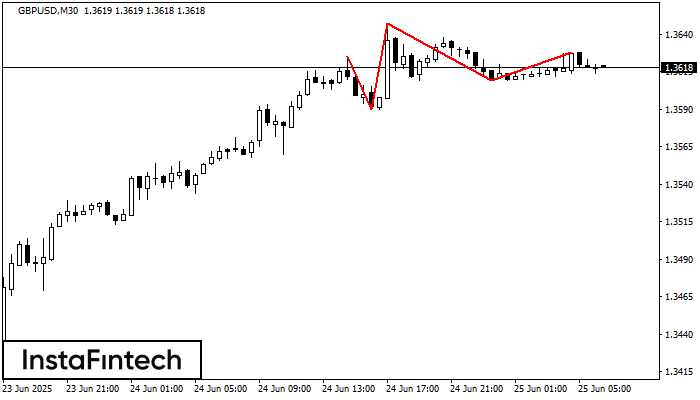
According to the chart of M30, GBPUSD formed the Head and Shoulders pattern. The Head’s top is set at 1.3647 while the median line of the Neck is found at 1.3590/1.3609. The formation of the Head and Shoulders pattern evidently signals a reversal of the upward trend. In other words, in case the scenario comes true, the price of GBPUSD will go towards 1.3579.
See Also
- All
- Double Top
- Flag
- Head and Shoulders
- Pennant
- Rectangle
- Triangle
- Triple top
- All
- #AAPL
- #AMZN
- #Bitcoin
- #EBAY
- #FB
- #GOOG
- #INTC
- #KO
- #MA
- #MCD
- #MSFT
- #NTDOY
- #PEP
- #TSLA
- #TWTR
- AUDCAD
- AUDCHF
- AUDJPY
- AUDUSD
- EURCAD
- EURCHF
- EURGBP
- EURJPY
- EURNZD
- EURRUB
- EURUSD
- GBPAUD
- GBPCHF
- GBPJPY
- GBPUSD
- GOLD
- NZDCAD
- NZDCHF
- NZDJPY
- NZDUSD
- SILVER
- USDCAD
- USDCHF
- USDJPY
- USDRUB
- All
- M5
- M15
- M30
- H1
- D1
- All
- Buy
- Sale
- All
- 1
- 2
- 3
- 4
- 5
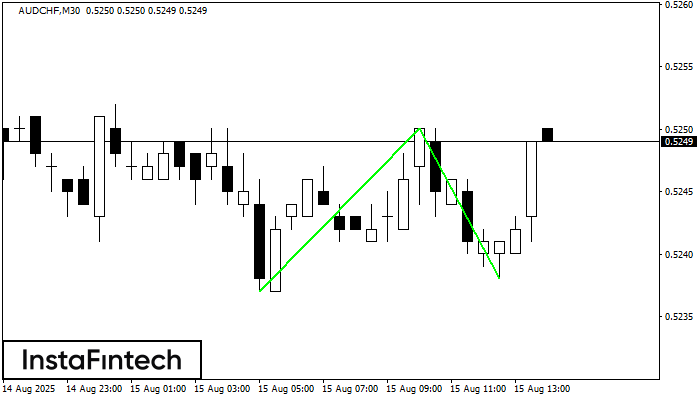
The Double Bottom pattern has been formed on AUDCHF M30. This formation signals a reversal of the trend from downwards to upwards. The signal is that a buy trade should
Open chart in a new window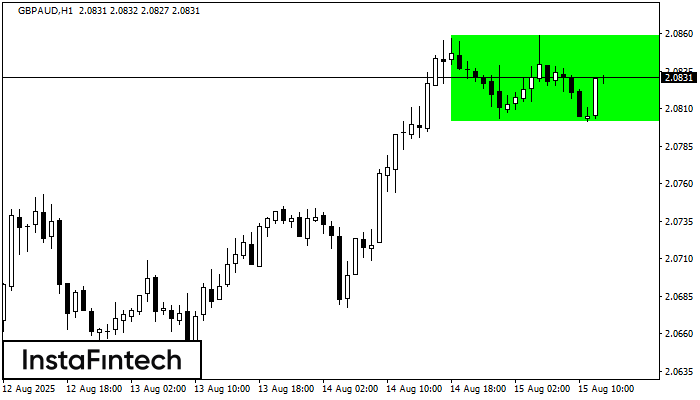
According to the chart of H1, GBPAUD formed the Bullish Rectangle. The pattern indicates a trend continuation. The upper border is 2.0859, the lower border is 2.0802. The signal means
Open chart in a new window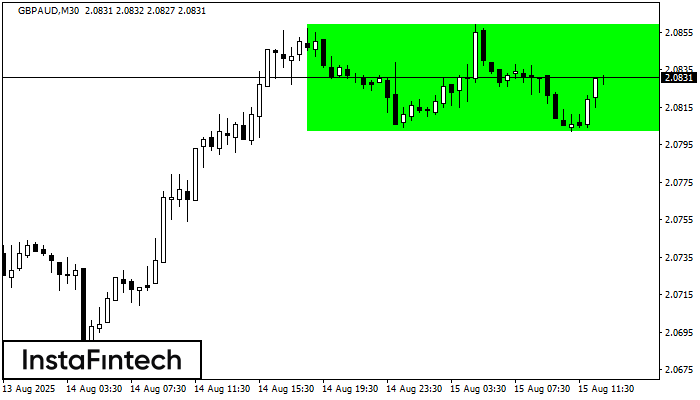
According to the chart of M30, GBPAUD formed the Bullish Rectangle. This type of a pattern indicates a trend continuation. It consists of two levels: resistance 2.0859 and support 2.0802
Open chart in a new window