

signal strength 1 of 5
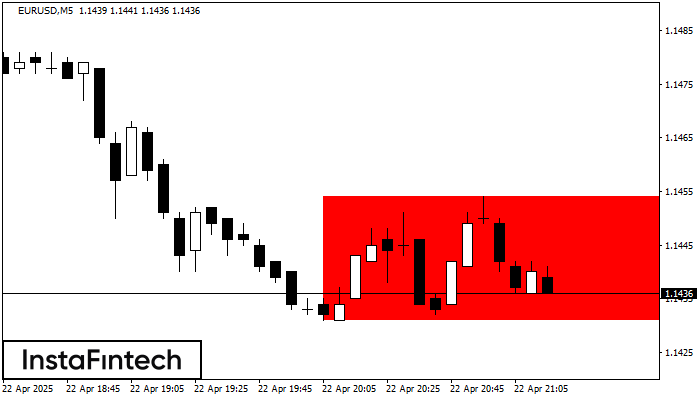
According to the chart of M5, EURUSD formed the Bearish Rectangle. The pattern indicates a trend continuation. The upper border is 1.1454, the lower border is 1.1431. The signal means that a short position should be opened after fixing a price below the lower border 1.1431 of the Bearish Rectangle.
The M5 and M15 time frames may have more false entry points.
- All
- Double Top
- Flag
- Head and Shoulders
- Pennant
- Rectangle
- Triangle
- Triple top
- All
- #AAPL
- #AMZN
- #Bitcoin
- #EBAY
- #FB
- #GOOG
- #INTC
- #KO
- #MA
- #MCD
- #MSFT
- #NTDOY
- #PEP
- #TSLA
- #TWTR
- AUDCAD
- AUDCHF
- AUDJPY
- AUDUSD
- EURCAD
- EURCHF
- EURGBP
- EURJPY
- EURNZD
- EURRUB
- EURUSD
- GBPAUD
- GBPCHF
- GBPJPY
- GBPUSD
- GOLD
- NZDCAD
- NZDCHF
- NZDJPY
- NZDUSD
- SILVER
- USDCAD
- USDCHF
- USDJPY
- USDRUB
- All
- M5
- M15
- M30
- H1
- D1
- All
- Buy
- Sale
- All
- 1
- 2
- 3
- 4
- 5

The Triple Bottom pattern has formed on the chart of AUDCHF M5. Features of the pattern: The lower line of the pattern has coordinates 0.5269 with the upper limit 0.5269/0.5268
The M5 and M15 time frames may have more false entry points.
Open chart in a new window
According to the chart of M5, GBPAUD formed the Bullish Symmetrical Triangle pattern, which signals the trend will continue. Description. The upper border of the pattern touches the coordinates 2.0911/2.0896
The M5 and M15 time frames may have more false entry points.
Open chart in a new window
According to the chart of M5, #TSLA formed the Bearish Symmetrical Triangle pattern. Trading recommendations: A breach of the lower border 313.81 is likely to encourage a continuation
The M5 and M15 time frames may have more false entry points.
Open chart in a new window


