


signal strength 1 of 5
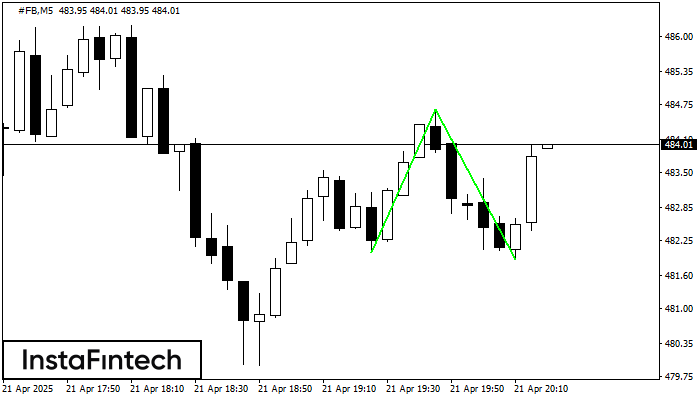
The Double Bottom pattern has been formed on #FB M5; the upper boundary is 484.65; the lower boundary is 481.90. The width of the pattern is 263 points. In case of a break of the upper boundary 484.65, a change in the trend can be predicted where the width of the pattern will coincide with the distance to a possible take profit level.
The M5 and M15 time frames may have more false entry points.
See Also
- All
- Double Top
- Flag
- Head and Shoulders
- Pennant
- Rectangle
- Triangle
- Triple top
- All
- #AAPL
- #AMZN
- #Bitcoin
- #EBAY
- #FB
- #GOOG
- #INTC
- #KO
- #MA
- #MCD
- #MSFT
- #NTDOY
- #PEP
- #TSLA
- #TWTR
- AUDCAD
- AUDCHF
- AUDJPY
- AUDUSD
- EURCAD
- EURCHF
- EURGBP
- EURJPY
- EURNZD
- EURRUB
- EURUSD
- GBPAUD
- GBPCHF
- GBPJPY
- GBPUSD
- GOLD
- NZDCAD
- NZDCHF
- NZDJPY
- NZDUSD
- SILVER
- USDCAD
- USDCHF
- USDJPY
- USDRUB
- All
- M5
- M15
- M30
- H1
- D1
- All
- Buy
- Sale
- All
- 1
- 2
- 3
- 4
- 5
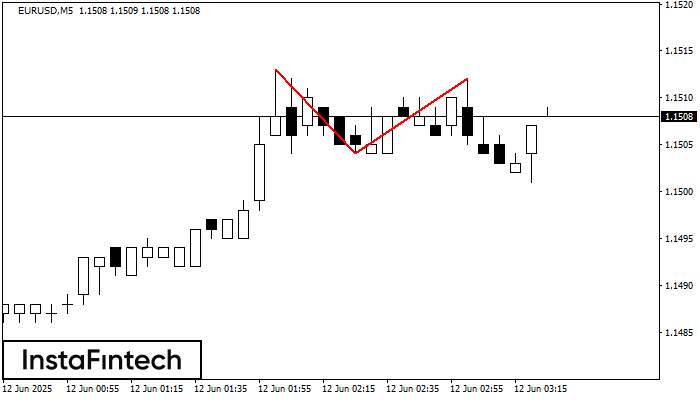
M5 চার্টে, EURUSD-এর ডাবল টপ রিভার্সাল বা বিপরীতমুখী প্যাটার্ন গঠিত হয়েছে। বৈশিষ্ট্য: উপরের সীমানা 1.1512; নীচের সীমানা 1.1504; প্যাটার্নের প্রস্থ 8 পয়েন্ট। সংকেত: নীচের সীমানা ব্রেক করা হলে 1.1489 স্তরের
M5 এবং M15 টাইম ফ্রেমে আরও ভুল এন্ট্রি পয়েন্ট থাকতে পারে।
Open chart in a new window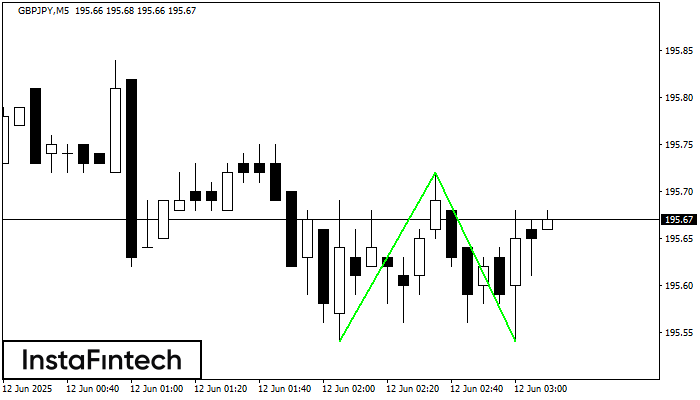
M5 চার্টে, GBPJPY-এর ডাবল বটম প্যাটার্নটি গঠিত হয়েছে। বৈশিষ্ট্য: সাপোর্ট স্তর হচ্ছে 195.54; রেজিস্ট্যান্স স্তর হচ্ছে 195.72; প্যাটার্নের প্রস্থ হচ্ছে 18 পয়েন্ট। রেজিস্ট্যান্স স্তর ভেদ করা হলে, 18 পয়েন্টের দূরত্বে
M5 এবং M15 টাইম ফ্রেমে আরও ভুল এন্ট্রি পয়েন্ট থাকতে পারে।
Open chart in a new window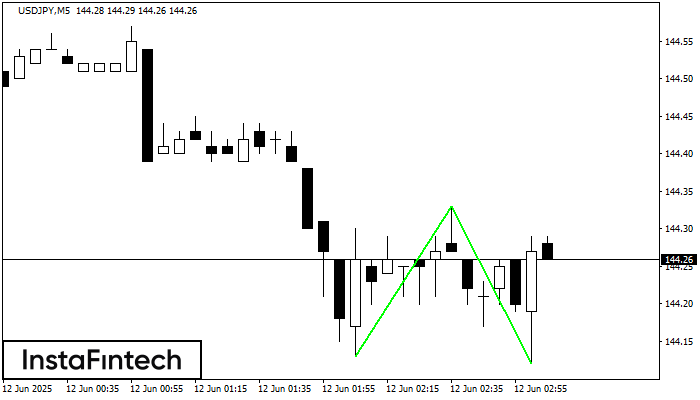
M5 চার্টে, USDJPY-এর ডাবল বটম প্যাটার্নটি গঠিত হয়েছে। বৈশিষ্ট্য: সাপোর্ট স্তর হচ্ছে 144.13; রেজিস্ট্যান্স স্তর হচ্ছে 144.33; প্যাটার্নের প্রস্থ হচ্ছে 20 পয়েন্ট। রেজিস্ট্যান্স স্তর ভেদ করা হলে, 21 পয়েন্টের দূরত্বে
M5 এবং M15 টাইম ফ্রেমে আরও ভুল এন্ট্রি পয়েন্ট থাকতে পারে।
Open chart in a new window


