signal strength 1 of 5
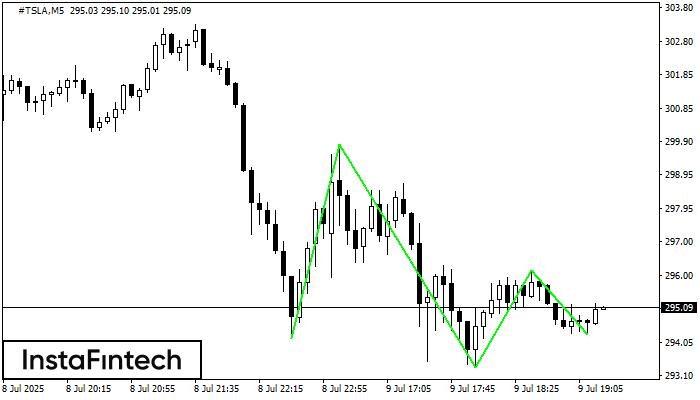
The Triple Bottom pattern has formed on the chart of #TSLA M5. Features of the pattern: The lower line of the pattern has coordinates 299.81 with the upper limit 299.81/296.14, the projection of the width is 563 points. The formation of the Triple Bottom pattern most likely indicates a change in the trend from downward to upward. This means that in the event of a breakdown of the resistance level 294.18, the price is most likely to continue the upward movement.
The M5 and M15 time frames may have more false entry points.
Vea asimismo
- All
- Double Top
- Flag
- Head and Shoulders
- Pennant
- Rectangle
- Triangle
- Triple top
- All
- #AAPL
- #AMZN
- #Bitcoin
- #EBAY
- #FB
- #GOOG
- #INTC
- #KO
- #MA
- #MCD
- #MSFT
- #NTDOY
- #PEP
- #TSLA
- #TWTR
- AUDCAD
- AUDCHF
- AUDJPY
- AUDUSD
- EURCAD
- EURCHF
- EURGBP
- EURJPY
- EURNZD
- EURRUB
- EURUSD
- GBPAUD
- GBPCHF
- GBPJPY
- GBPUSD
- GOLD
- NZDCAD
- NZDCHF
- NZDJPY
- NZDUSD
- SILVER
- USDCAD
- USDCHF
- USDJPY
- USDRUB
- All
- M5
- M15
- M30
- H1
- D1
- All
- Buy
- Sale
- All
- 1
- 2
- 3
- 4
- 5
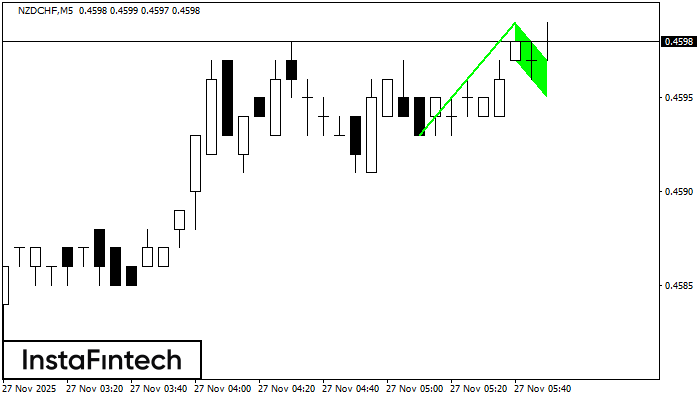
El patrón Bandera alcista ha sido formado en NZDCHF a M5. El límite inferior del patrón está ubicado en 0.4597/0.4595, mientras que el límite superior se encuentra en 0.4599/0.4597
Los marcos de tiempo M5 y M15 pueden tener más puntos de entrada falsos.
Open chart in a new window
El patrón gráfico Banderín alcista se ha formado en el instrumento NZDCHF M5. Este tipo de patrón entra en la categoría de patrones de continuación. En este caso
Los marcos de tiempo M5 y M15 pueden tener más puntos de entrada falsos.
Open chart in a new window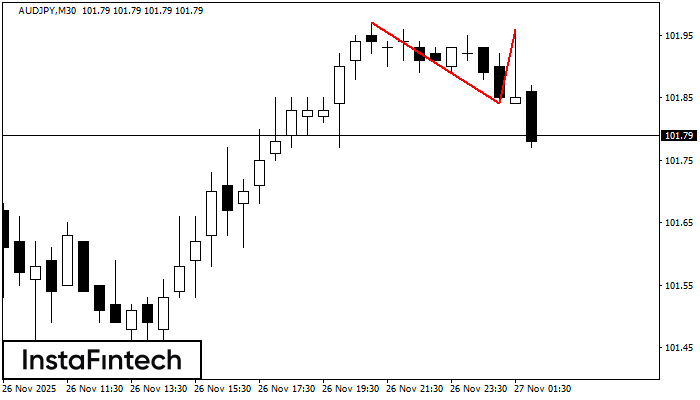
El patrón Doble Techo ha sido formado en AUDJPY M30. Esto señala que la tendencia ha sido cambiada de alcista a bajista. Probablemente, si la base del patrón 101.84
Open chart in a new window