signal strength 1 of 5

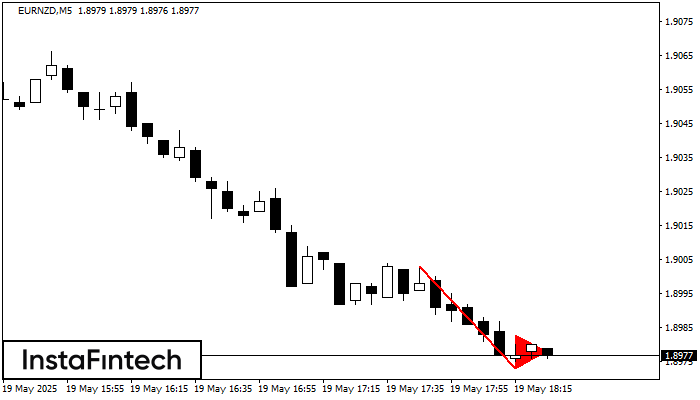
The Bearish pennant pattern has formed on the EURNZD M5 chart. This pattern type is characterized by a slight slowdown after which the price will move in the direction of the original trend. In case the price fixes below the pattern’s low of 1.8973, a trader will be able to successfully enter the sell position.
The M5 and M15 time frames may have more false entry points.
Vea asimismo
- All
- Double Top
- Flag
- Head and Shoulders
- Pennant
- Rectangle
- Triangle
- Triple top
- All
- #AAPL
- #AMZN
- #Bitcoin
- #EBAY
- #FB
- #GOOG
- #INTC
- #KO
- #MA
- #MCD
- #MSFT
- #NTDOY
- #PEP
- #TSLA
- #TWTR
- AUDCAD
- AUDCHF
- AUDJPY
- AUDUSD
- EURCAD
- EURCHF
- EURGBP
- EURJPY
- EURNZD
- EURRUB
- EURUSD
- GBPAUD
- GBPCHF
- GBPJPY
- GBPUSD
- GOLD
- NZDCAD
- NZDCHF
- NZDJPY
- NZDUSD
- SILVER
- USDCAD
- USDCHF
- USDJPY
- USDRUB
- All
- M5
- M15
- M30
- H1
- D1
- All
- Buy
- Sale
- All
- 1
- 2
- 3
- 4
- 5
En el gráfico de AUDCHF M15 el patrón de reversión Doble Techo ha sido formado. Características: límite superior 0.5252; límite inferior 0.5243; el ancho del patrón 9 puntos. La señal
Los marcos de tiempo M5 y M15 pueden tener más puntos de entrada falsos.
Open chart in a new windowEl patrón Triple Techo ha sido formado en el gráfico de AUDCHF M5. Características del patrón: los límites tienen un ángulo ascendente, la línea inferior del patrón tiene coordenadas 0.5243/0.5246
Los marcos de tiempo M5 y M15 pueden tener más puntos de entrada falsos.
Open chart in a new windowSegún el gráfico de M30, USDCHF formó el Rectángulo Bajista. El patrón indica la continuación de una tendencia. El límite superior es 0.8020, el límite inferior es 0.7977. La señal
Open chart in a new window