signal strength 1 of 5

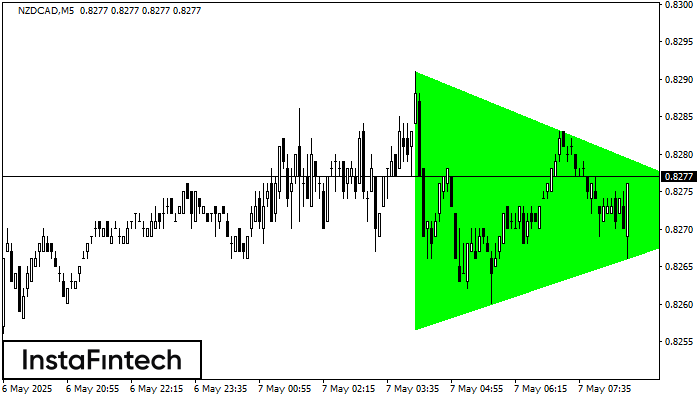
According to the chart of M5, NZDCAD formed the Bullish Symmetrical Triangle pattern, which signals the trend will continue. Description. The upper border of the pattern touches the coordinates 0.8291/0.8272 whereas the lower border goes across 0.8257/0.8272. The pattern width is measured on the chart at 34 pips. If the Bullish Symmetrical Triangle pattern is in progress during the upward trend, this indicates the current trend will go on. In case 0.8272 is broken, the price could continue its move toward 0.8287.
The M5 and M15 time frames may have more false entry points.
- All
- Double Top
- Flag
- Head and Shoulders
- Pennant
- Rectangle
- Triangle
- Triple top
- All
- #AAPL
- #AMZN
- #Bitcoin
- #EBAY
- #FB
- #GOOG
- #INTC
- #KO
- #MA
- #MCD
- #MSFT
- #NTDOY
- #PEP
- #TSLA
- #TWTR
- AUDCAD
- AUDCHF
- AUDJPY
- AUDUSD
- EURCAD
- EURCHF
- EURGBP
- EURJPY
- EURNZD
- EURRUB
- EURUSD
- GBPAUD
- GBPCHF
- GBPJPY
- GBPUSD
- GOLD
- NZDCAD
- NZDCHF
- NZDJPY
- NZDUSD
- SILVER
- USDCAD
- USDCHF
- USDJPY
- USDRUB
- All
- M5
- M15
- M30
- H1
- D1
- All
- Buy
- Sale
- All
- 1
- 2
- 3
- 4
- 5
El patrón Triple Techo ha sido formado en el gráfico del instrumento de negociación GOLD M5. Este es un patrón de reversión que presenta las siguientes características: nivel de resistencia
Los marcos de tiempo M5 y M15 pueden tener más puntos de entrada falsos.
Open chart in a new windowEl patrón Doble Techo ha sido formado en SILVER M5. Esto señala que la tendencia ha sido cambiada de alcista a bajista. Probablemente, si la base del patrón 36.10
Los marcos de tiempo M5 y M15 pueden tener más puntos de entrada falsos.
Open chart in a new windowEl patrón Triple Techo ha sido formado en el gráfico de #Bitcoin M5. Características del patrón: los límites tienen un ángulo ascendente, la línea inferior del patrón tiene coordenadas 101585.50/101702.37
Los marcos de tiempo M5 y M15 pueden tener más puntos de entrada falsos.
Open chart in a new window