empty
27.03.2024 03:03 PM
GBP/USD: trading scenarios on March 27, 2024

This image is no longer relevant

The results of the Bank of England's March meeting and comments from its leaders exerted pressure on the pound and the GBP/USD pair.

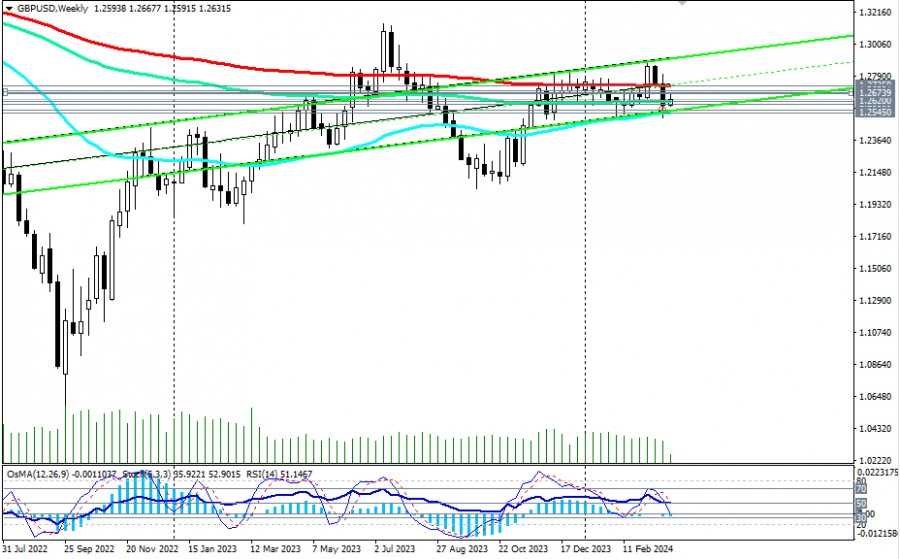
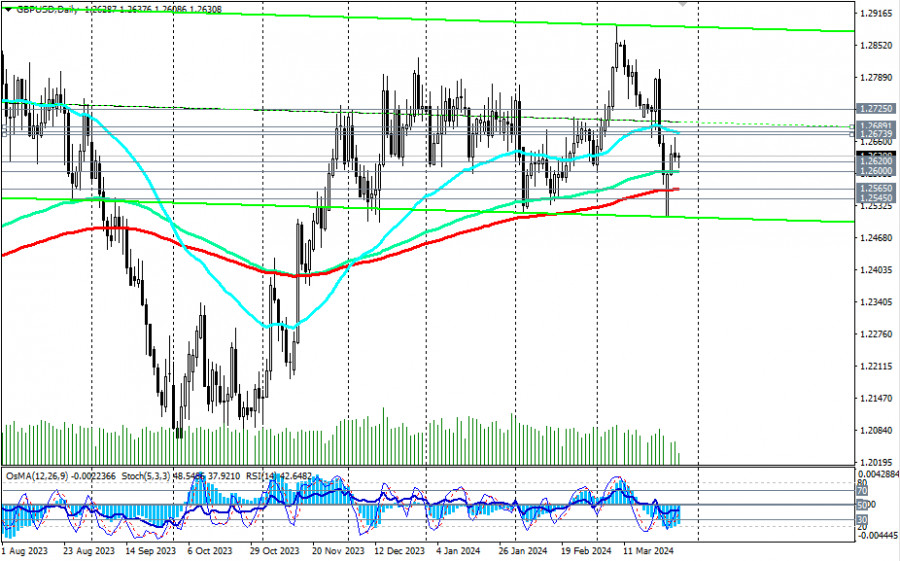
The next day, the pair tested key support levels for a breakthrough: 1.2565 (200 EMA on the daily chart) and 1.2545 (50 EMA on the weekly chart), separating the medium-term bullish market from the bearish one.

This image is no longer relevant

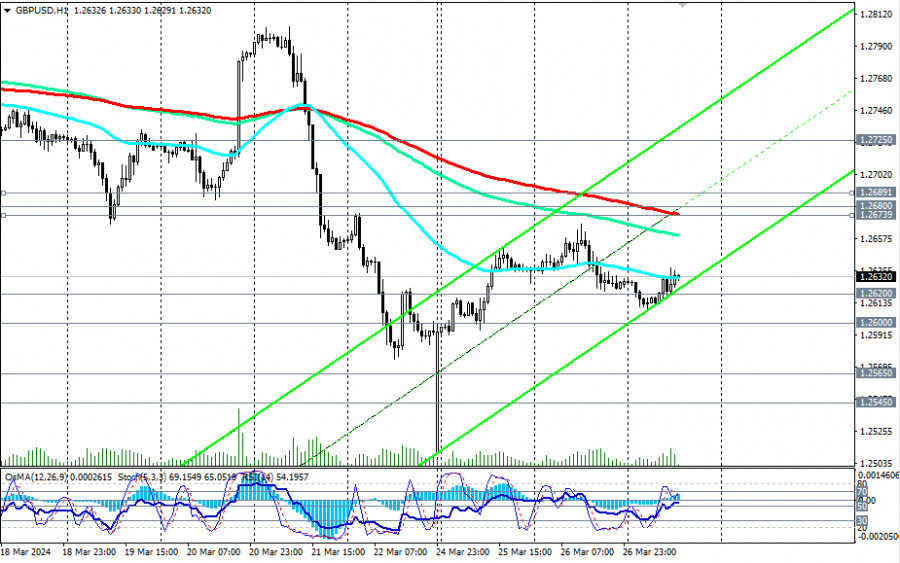
Subsequently, GBP/USD managed to recover somewhat, rising from a local low of 1.2510 to the resistance zone at levels 1.2674 (200 EMA on the 1-hour chart), 1.2680 (50 EMA on the daily chart), and 1.2689 (200 EMA on the 4-hour chart).

However, the corrective potential dried up near the 1.2667 mark, and GBP/USD resumed its decline.

This image is no longer relevant

Thus, as of this writing, it was trading near the 1.2632 mark, declining towards the important support level of 1.2600 (144 EMA on the daily chart).

At the same time, technical indicators such as OsMA, RSI, and Stochastic on the daily and weekly charts are favoring sellers, signaling the advantage of short positions.

A breakout below the key support level of 1.2600 could be the first signal for new medium-term short positions, with the breakout of key support levels of 1.2565 and 1.2545 confirming this.

Moreover, below the key resistance level of 1.2725, GBP/USD is in the long-term bearish market zone, giving preference to long-term short positions.

In an alternative scenario, if GBP/USD resumes its rise, it will again head towards the resistance zone near levels 1.2674, 1.2680, and 1.2690. Their breakout could trigger further growth towards the key resistance level of 1.2725. Its breakout, in turn, will lead the pair into the long-term bullish market zone, which would be the first signal for long-term long positions.

For now, the advantage lies with the shorts.

Support levels: 1.2600, 1.25656, 1.2545, 1.2500

Resistance levels: 1.2674, 1.2680, 1.2689, 1.2700, 1.2725, 1.2800, 1.2830, 1.2860, 1.2890, 1.2900, 1.3000, 1.3100, 1.3140

Trading Scenarios:

Main scenario: Sell Stop 1.2590. Stop-Loss 1.2655. Targets 1.25656, 1.2545, 1.2500

Alternative scenario: Buy Stop 1.2655. Stop-Loss 1.2590. Targets 1.2674, 1.2680, 1.2689, 1.2700, 1.2725, 1.2800, 1.2830, 1.2860, 1.2890, 1.2900, 1.3000, 1.3100, 1.3140

"Targets" correspond to support/resistance levels. This also does not mean that they will necessarily be reached, but they can serve as a guide when planning and placing trading positions.

Summary
Urgency
Analytic
Jurij Tolin
Start trade
Gana con los cambios en el valor de las criptomonedas con InstaForex.
Descarga MetaTrader 4 y abre tu primera operación.
  • Grand Choice
    Contest by
    InstaForex
    InstaForex always strives to help you
    fulfill your biggest dreams.
    UNIRSE AL CONCURSO

Recommended Stories

EUR/USD: plan para la sesión europea del 23 de julio. Informes COT (análisis de las operaciones de ayer). El euro creció bastante bien

Ayer se formaron varios puntos de entrada al mercado. Vamos a ver el gráfico de 5 minutos y entender qué pasó allí. En mi pronóstico de la mañana presté atención

Miroslaw Bawulski 08:47 2025-07-23 UTC+2

Recomendaciones para operar y análisis de las operaciones con el par GBP/USD el 23 de julio. El crecimiento lógico continúa.

El par de divisas GBP/USD también continúa su movimiento ascendente durante el martes. La nueva caída de la moneda estadounidense puede intentarse vincular con el discurso de Jerome Powell, como

Paolo Greco 07:54 2025-07-23 UTC+2

Recomendaciones para operar y análisis de las operaciones con el par EUR/USD el 23 de julio. La caída predecible del dólar continúa.

El par de divisas EUR/USD durante el martes permaneció inmóvil durante la primera mitad del día y en la segunda mitad se negoció al alza. En la segunda mitad

Paolo Greco 07:54 2025-07-23 UTC+2

EUR/USD: plan para la sesión europea del 22 de julio. Informes COT (análisis de las operaciones de ayer). Los compradores del euro se activaron

Ayer se formaron varios puntos de entrada al mercado. Vamos a mirar el gráfico de 5 minutos y analizar lo que ocurrió. En mi pronóstico de la mañana presté atención

Miroslaw Bawulski 07:51 2025-07-22 UTC+2

Cómo operar el par GBP/USD el 22 de julio. Consejos simples y análisis de operaciones para principiantes.

El par GBP/USD mostró el lunes exactamente los mismos movimientos que el par EUR/USD. Por lo tanto, es evidente que en todo el mercado el dólar estadounidense comenzó una nueva

Paolo Greco 07:51 2025-07-22 UTC+2

Cómo operar el par EUR/USD el 22 de julio. Consejos simples y análisis de operaciones para principiantes.

El par de divisas EUR/USD aparentemente completó el lunes una tendencia bajista de tres semanas. Recordemos que durante al menos las últimas dos semanas, desde Estados Unidos llegaba una gran

Paolo Greco 07:51 2025-07-22 UTC+2

EUR/USD: plan para la sesión europea del 21 de julio. Informes COT (análisis de las operaciones de ayer). La corrección del euro se acerca a su final

El viernes pasado se formó solo un punto de entrada al mercado. Veamos el gráfico de 5 minutos y analicemos lo que ocurrió. En mi pronóstico de la mañana, presté

Miroslaw Bawulski 08:11 2025-07-21 UTC+2

Idea de negociación del oro a la baja

Después de una fuerte iniciativa bajista de dos días, el instrumento pasó a una corrección alcista y en este momento está testeando la zona de ruptura bajista, desde la cual

Andrey Shevchenko 11:36 2025-07-18 UTC+2

GBP/USD plan para la sesión europea del 18 de julio. Informes Commitment of Traders COT (análisis de las operaciones de ayer). La libra esterlina se recuperó ligeramente

Ayer se formó solo un punto de entrada al mercado. Veamos el gráfico de 5 minutos y analicemos lo que ocurrió. En mi pronóstico de la mañana, presté atención

Miroslaw Bawulski 07:50 2025-07-18 UTC+2

EUR/USD plan para la sesión europea del 18 de julio. Informes Commitment of Traders COT (análisis de las operaciones de ayer). El euro rebotó desde el mínimo semanal

Ayer se formó solo un punto de entrada al mercado. Veamos el gráfico de 5 minutos y analicemos lo que ocurrió. En mi pronóstico de la mañana, presté atención

Miroslaw Bawulski 07:50 2025-07-18 UTC+2
¿No puede hablar ahora mismo?
Ingrese su pregunta en el chat.
Widget callback
 

Dear visitor,

Your IP address shows that you are currently located in the USA. If you are a resident of the United States, you are prohibited from using the services of InstaFintech Group including online trading, online transfers, deposit/withdrawal of funds, etc.

If you think you are seeing this message by mistake and your location is not the US, kindly proceed to the website. Otherwise, you must leave the website in order to comply with government restrictions.

Why does your IP address show your location as the USA?

  • - you are using a VPN provided by a hosting company based in the United States;
  • - your IP does not have proper WHOIS records;
  • - an error occurred in the WHOIS geolocation database.

Please confirm whether you are a US resident or not by clicking the relevant button below. If you choose the wrong option, being a US resident, you will not be able to open an account with InstaForex anyway.

We are sorry for any inconvenience caused by this message.