Trade Analysis for Monday:
1H Chart of the GBP/USD Pair
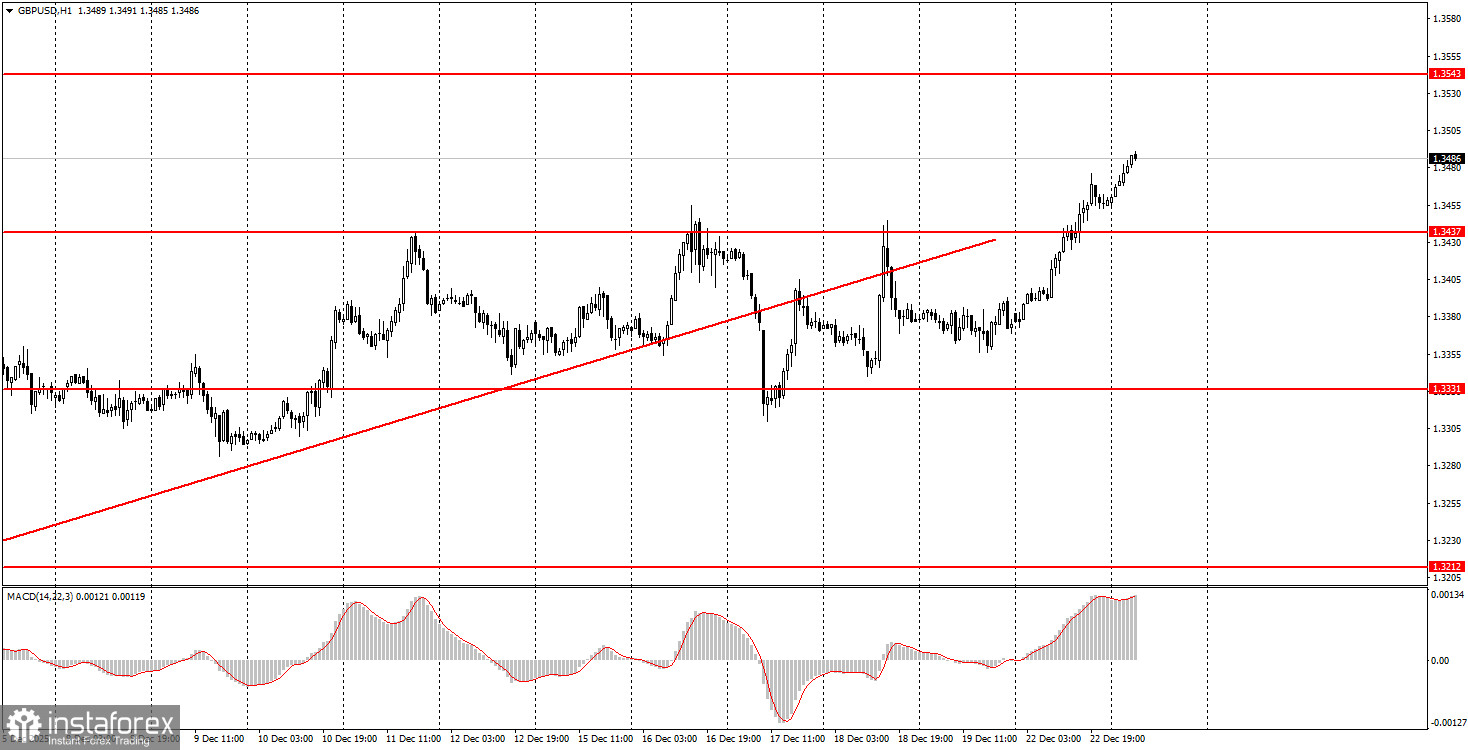
The GBP/USD pair rose by 110 pips on Monday, easily leaving the weekly sideways channel of 1.3331-1.3437. We mentioned that the British pound would continue to rise, while the dollar would decline. The market is currently "thin," which makes it easier for large players to move the price in the desired direction during the holidays than at other times. Recall that last week, there was an abundance of macroeconomic reports and fundamental events, and the price remained in a sideways channel throughout that week. However, on the first day of the holiday period, the pound showed an increase of 100 pips, despite a lack of significant impact from the only report of the day – the GDP in the UK. This indicates that traders had nothing to react to yesterday. Nevertheless, the rise of the British currency continued into the night, further proving that the five-month downward correction has ended and the global uptrend for 2025 is resuming.
5M Chart of the GBP/USD Pair
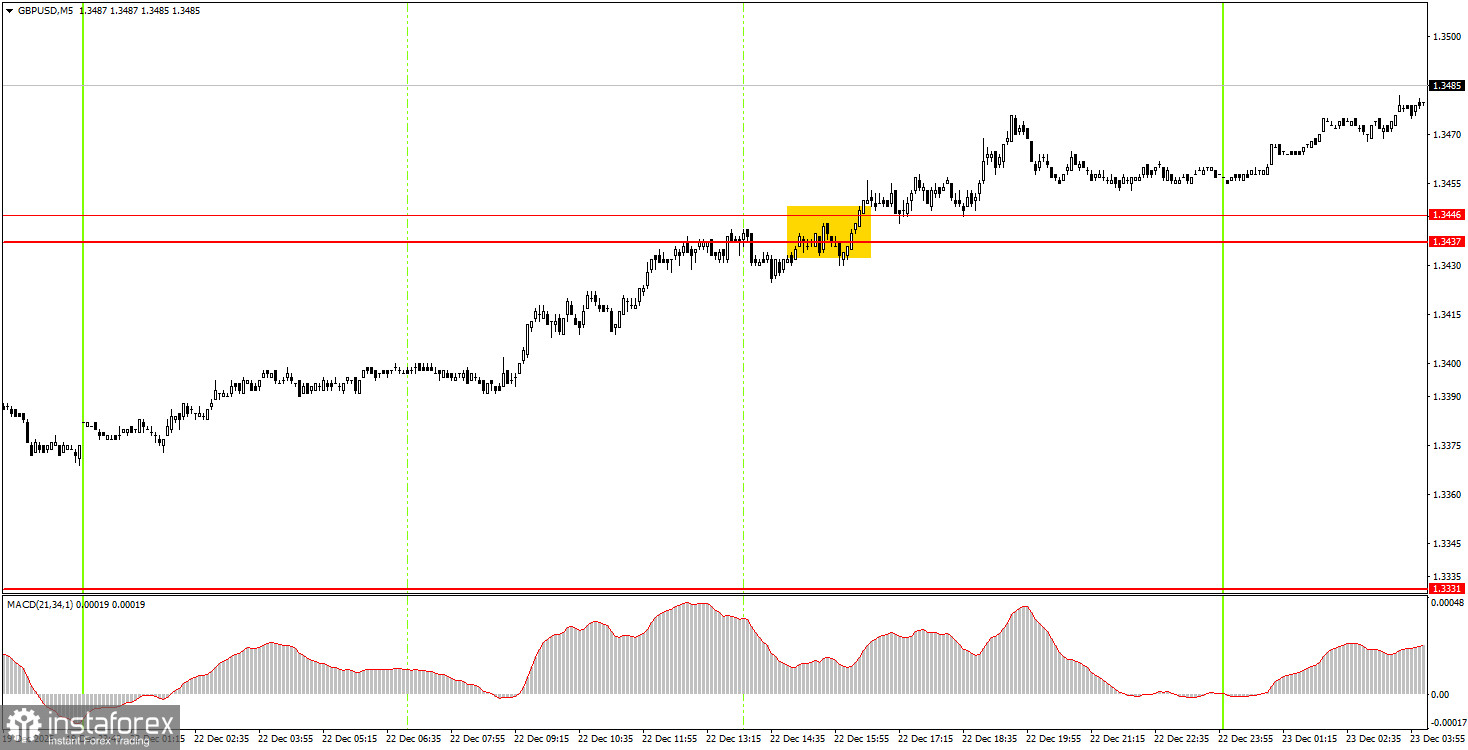
On the 5-minute timeframe, one trade signal was generated on Monday. In the US trading session, the pair broke above the 1.3437-1.3446 range, allowing novice traders to open long positions. These trades remain relevant today, so profit may increase throughout the day.
How to Trade on Tuesday:
On the hourly timeframe, the GBP/USD pair has completed its flat movement and is once again moving upward. We fully support this scenario, as we have stated multiple times. There are no global grounds for medium-term dollar growth; therefore, we expect movement only to the upside. Overall, we anticipate a resumption of the global uptrend in 2025, which may push the pair to the 1.4000 mark in the next couple of months.
On Tuesday, novice traders can consider new long positions if the price bounces off the 1.3437-1.3446 area, targeting 1.3529. However, a corresponding buy signal was generated yesterday.
On the 5-minute timeframe, trading levels include 1.2913, 1.2980-1.2993, 1.3043, 1.3096-1.3107, 1.3203-1.3212, 1.3259-1.3267, 1.3319-1.3331, 1.3437-1.3446, 1.3529-1.3543, and 1.3574-1.3590. There are no significant events scheduled in the UK for Tuesday, while in the US, reports on industrial production, durable goods orders, and the third-quarter GDP in its second estimate will be published. This data is quite important, and no other events are scheduled this week. Therefore, during today's US trading session, the price may either accelerate its rise or sharply reverse downward.
Key Rules of the Trading System:
- The strength of a signal is assessed by the time it takes to form the signal (bounce or breakout). The less time it takes, the stronger the signal.
- If two or more trades were opened near any level based on false signals, all subsequent signals from that level should be ignored.
- In a flat, any pair can create numerous false signals or none at all. In any case, it's better to stop trading at the first signs of a flat.
- Trades are opened during the period between the start of the European session and the middle of the American session, after which all trades must be closed manually.
- On the hourly timeframe, when trading based on signals from the MACD indicator, it is preferable to trade only when good volatility is present, and a trend is confirmed by a trend line or channel.
- If two levels are positioned too closely to each other (5 to 20 points), they should be viewed as a support or resistance area.
- After moving 20 pips in the right direction, set the Stop Loss to breakeven.
Chart Explanation:
- Support and Resistance Levels: Levels that serve as targets for opening buys or sells. Take Profit levels can be placed near them.
- Red Lines: Channels or trend lines that reflect the current trend and indicate the preferred direction for trading.
- MACD Indicator (14, 22, 3): A histogram and signal line, a supplementary indicator that can also be used as a source of signals.
Important Note: Significant speeches and reports (always included in the news calendar) can greatly influence the movement of the currency pair. Therefore, during their release, it is advisable to trade cautiously or exit the market to avoid sharp reversals against the preceding movement.
Remember: For beginners trading in the Forex market, it is important to understand that not every trade can be profitable. Developing a clear strategy and practicing money management are keys to long-term trading success.