The EUR/USD currency pair resumed its upward movement on Wednesday and Thursday. This marks the market's almost first logical reaction to an important fundamental event in recent months. Remember that on Wednesday evening, the Federal Reserve announced its decision to lower the key interest rate by another 0.25%, which, naturally, was expected to provoke a decline in the US dollar. However, starting from September, the market had been engaged in various activities, excluding a logical response to macroeconomics and fundamentals. The explanation for this is quite simple — the sideways movement on the daily timeframe. Based on this same sideways trend, we have predicted a rise in the pair to 1.1800, even without the Fed meeting.
It should be understood that the market has been trading illogically for the past few months, but this situation cannot last forever. A sideways range always leads to random movements and is never a coincidence. Simply put, a sideways range occurs when market makers establish new positions in anticipation of a new trend. Therefore, the movements we have observed over the last five months (and continue to observe) should not be explained by macroeconomic or fundamental events. The pair is currently rising primarily because it has reversed near the lower boundary of the sideways channel at 1.1400-1.1830. Thus, a move to initiate a downward trend has not happened after the sideways range. There were no grounds for such a scenario.
Now we should expect growth toward the upper boundary of the range, and two scenarios may follow. Either a new reversal downward and continuation of the sideways movement, or a breakout from the range and resumption of the upward trend of 2025. Of course, we favor the second option.
If we analyze the Fed meeting in detail, the dollar was more expected to show growth. Yes, the key rate was lowered; however, what was surprising about this for traders? For three consecutive weeks, information has been flowing from every source stating that the Fed is preparing for another round of easing. Thus, the market had ample time to price in this event in advance. As for 2026, which, by the way, begins in 20 days, the Fed has revealed completely different plans, which we have also warned about multiple times.
The Fed plans to pause the easing process until inflation moves towards the target level of 2%. How will inflation move towards 2% if the Fed has cut rates three times already? However, understanding this allows us to assume that the next rate cut will not happen anytime soon. This is excellent news for the US dollar, as in 2025, anything that isn't bad is already good. Nevertheless, the market, which has held the dollar in a "golden cage" for five months, has grown tired of this. On the daily timeframe, the pair could return to the yearly highs before the New Year.
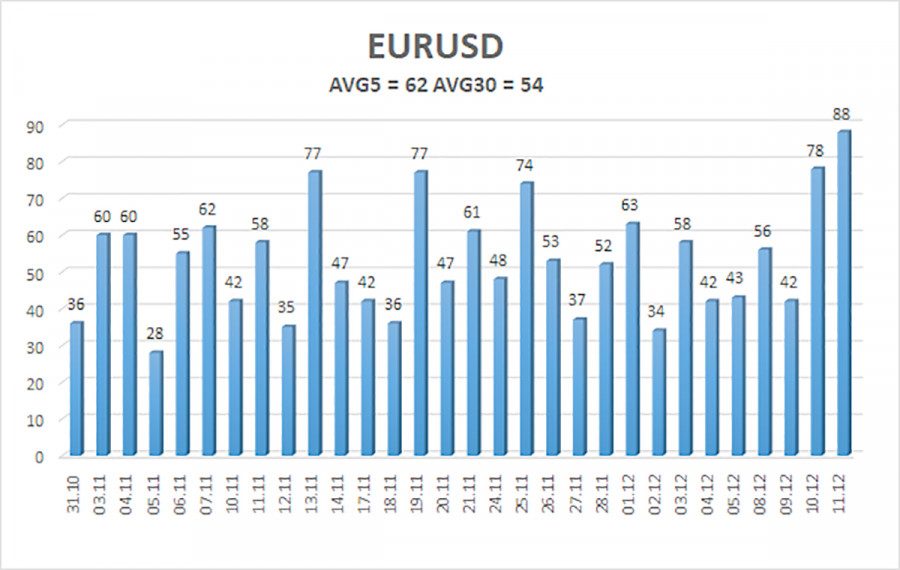
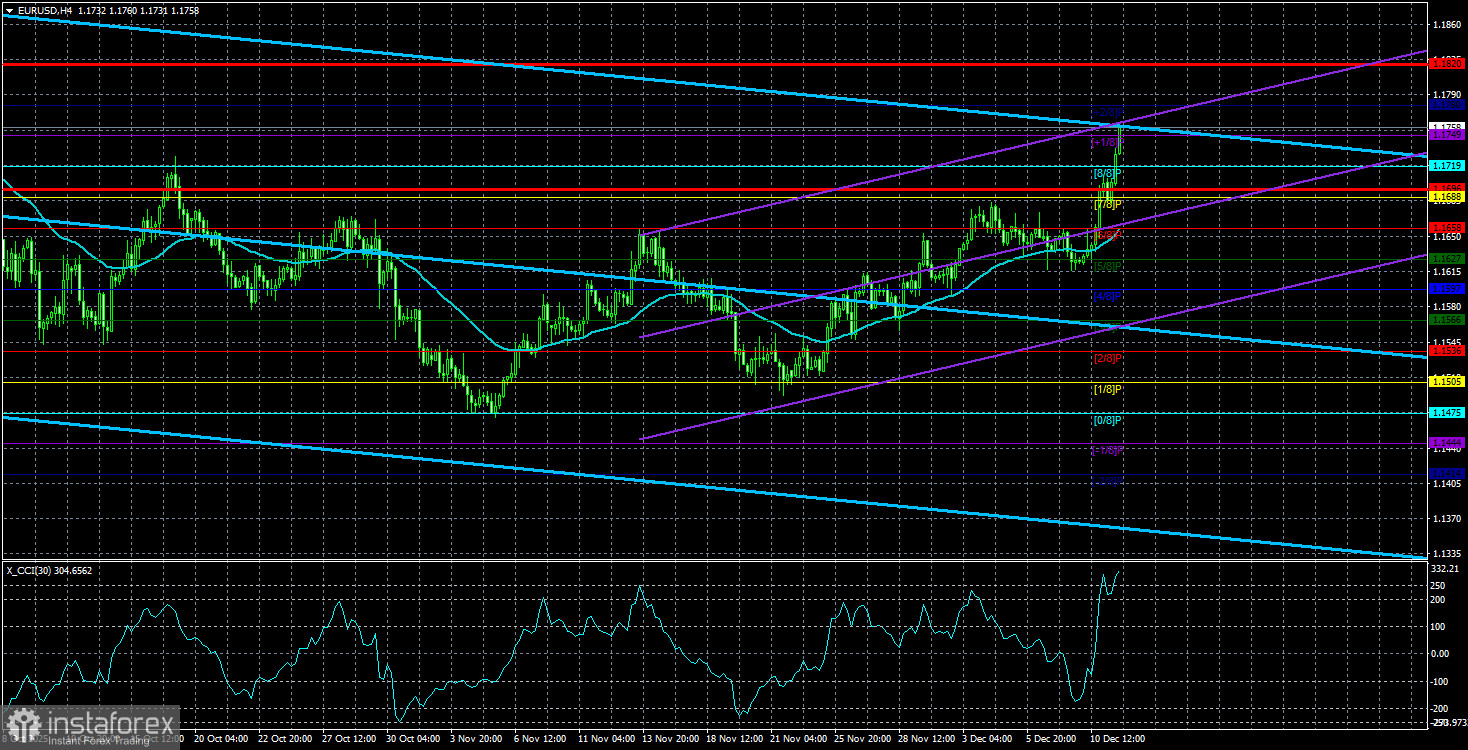
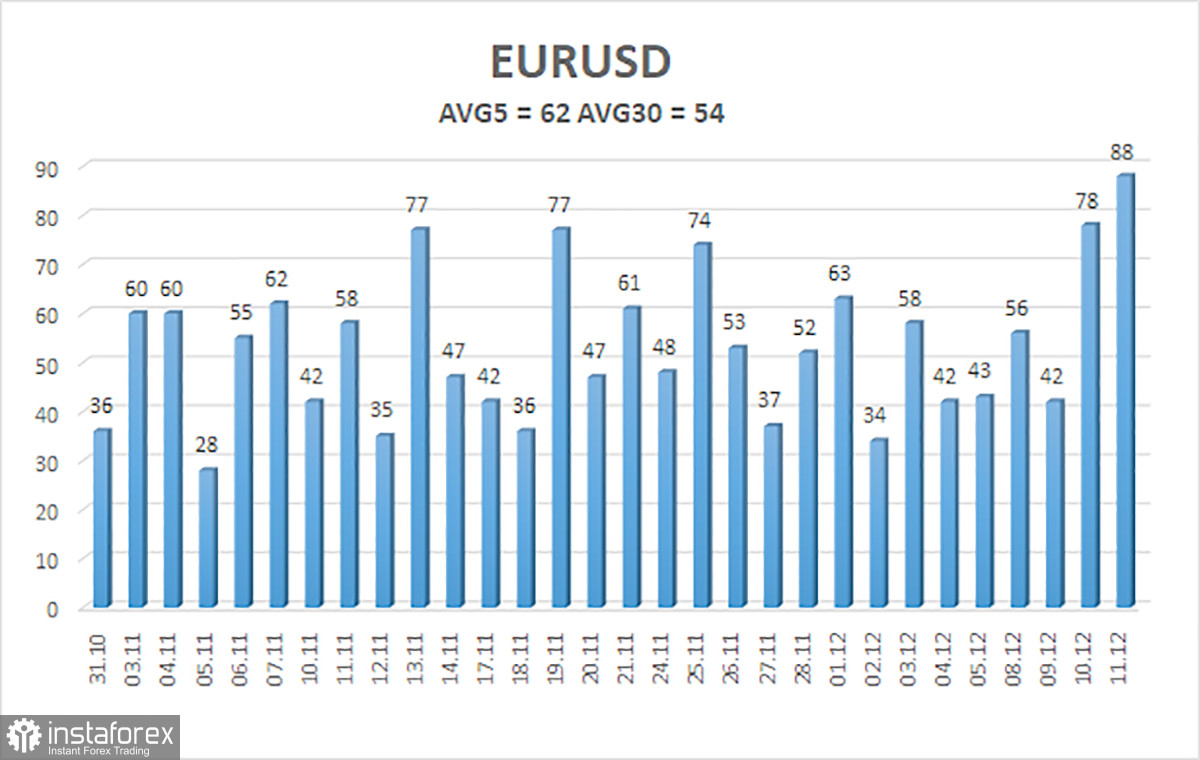
The average volatility of the EUR/USD pair over the last five trading days as of December 12 is 62 pips, characterized as "medium." We expect the pair to move between levels 1.1696 and 1.1820 on Friday. The upper channel of linear regression is directed downwards, signaling a bearish trend, but in reality, the pair is still in a sideways range on the daily timeframe. The CCI indicator entered the oversold area twice in October (!!!), which may provoke a new upward trend in 2025.
Nearest Support Levels:
- S1 – 1.1749
- S2 – 1.1719
- S3 – 1.1688
Nearest Resistance Levels:
Trading Recommendations:
On Friday, traders can trade from the area of 1.1750-1.1760. A price bounce from this area will allow traders to open short positions targeting the Kijun-sen line at 1.1686. A breakout of the stated area will allow for holding long positions or opening new ones with a target of 1.1800-1.1830.
Notes on Illustrations:
- Support and resistance price levels (resistance/support) — thick red lines near which the movement may end. They are not sources of trading signals.
- The Kijun-sen and Senkou Span B lines are Ichimoku indicator lines transferred to the hourly timeframe from the 4-hour timeframe. They are considered strong lines.
- Extreme levels are thin red lines from which the price has previously bounced. They are sources of trading signals.
- Yellow lines denote trendlines, trend channels, and any other technical patterns.
- Indicator 1 on COT charts shows the net position size of each category of traders.