empty
21.08.2024 06:31 PM
Analysis for EUR/USD pair on August 21: FOMC Minutes and Revisions to Nonfarm Payrolls

This image is no longer relevant

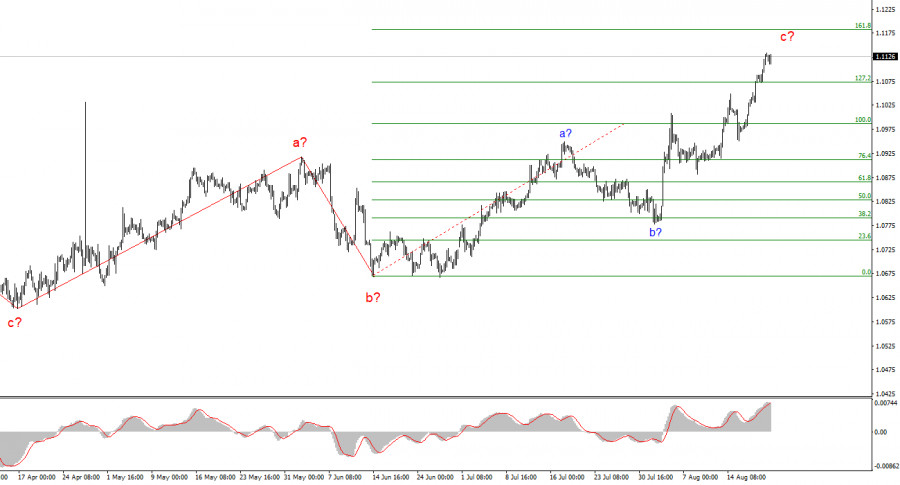
The wave pattern on the 4-hour chart for EUR/USD is becoming increasingly complex. If we analyze the entire trend segment that began in September 2022, when the euro dropped to 0.9530, it appears that we are within an upward wave set. However, even within this segment, it is challenging to distinguish waves of a higher scale. In other words, there is no clear impulsive trend. We are witnessing a constant alternation of three- and five-wave corrective structures. Even now, the market hasn't managed to form a clear three-wave downward pattern from the peak reached in July of last year. First, there was a downward wave that covered the lows of previous waves, followed by a deep upward wave, and now, for seven months, the market has been forming something unclear.

Since January 2024, I can only identify two a-b-c three-wave structures with a reversal point on April 16. Therefore, the first thing to understand is that there is no trend at the moment. After the completion of the current wave c, a new three-wave downward pattern may begin to form. The trend segment from April 16 may take on a five-wave form, but it would still be corrective. Under such circumstances, I cannot believe in a prolonged rise of the euro, although it may continue for several more months.

The EUR/USD exchange rate remained unchanged on Wednesday, but "the day isn't over yet." Demand for the U.S. dollar has been decreasing for two consecutive weeks, with only a brief pause in this process last Thursday. This week, there has been no significant news background, but the market finds new reasons to sell the U.S. currency almost every day. Therefore, I wouldn't be surprised if the dollar depreciates further by the end of the day. Analysts attribute this decline in the U.S. currency to the anticipated Fed rate cuts, the threat of a recession in the U.S. economy, worsening labor market conditions, rising unemployment, and the possible victory of Donald Trump in the upcoming elections. I believe that economists are making concerted efforts to explain the continued decline of the dollar.

Today, the minutes of the July FOMC meeting will be released in the U.S., which could easily be used to further decrease demand for the dollar. No "dovish" decisions were made at the last meeting, but the FOMC is approaching the point of deciding on a rate cut. Consequently, almost any content in the minutes can be interpreted as "dovish." Over the past two weeks, the market has sold the dollar based on much more contradictory information. From a wave perspective, everything remains stable, and the construction of wave c continues.

Conclusions

Based on the analysis of EUR/USD, I conclude that the instrument continues to form a series of corrective structures. From the current position, the upward movement may continue within a five-wave corrective structure, and the scenario of forming a downward wave d has been temporarily canceled. The 1.1073 level couldn't even halt the instrument's growth for half an hour. Consequently, the upward movement may continue with targets around 1.1182, corresponding to the 161.8% Fibonacci level. The market continues to price in Fed rate cuts in September, November, December, and in 2025.

On a larger wave scale, it is also evident that the wave pattern is becoming more complex. It is likely that we are facing a new upward wave set, but its length and structure are difficult to predict at this time.

Key Principles of My Analysis:

  1. Wave structures should be simple and clear. Complex structures are difficult to trade and often undergo changes.
  2. If you are unsure of what is happening in the market, it's better to stay out of it.
  3. There is never 100% certainty in the direction of movement. Don't forget about protective Stop Loss orders.
  4. Wave analysis can be combined with other types of analysis and trading strategies.
Chin Zhao,
انسٹافاریکس کا تجزیاتی ماہر
© 2007-2025
Summary
Urgency
Analytic
Alexander Dneprovskiy
Start trade
انسٹافاریکس کے ساتھ کرپٹو کرنسی کی معاملاتی تبدیلیوں سے کمائیں۔
میٹا ٹریڈر 4 ڈاؤن لوڈ کریں اور اپنی پہلی ٹریڈ کھولیں۔
  • Grand Choice
    Contest by
    InstaForex
    InstaForex always strives to help you
    fulfill your biggest dreams.
    مقابلہ میں شامل ہوں

تجویز کردہ مضامین

اگست 22 2025 کو جی بی پی / یو ایس ڈی تجزیہ

جی بی پی / یو ایس ڈی کے لیے، ویوو کا انداز اوپر کی طرف آنے والی لہر کی ساخت کی ترقی کی نشاندہی کرتا ہے۔ لہر کی ترتیب تقریباً

Chin Zhao 16:38 2025-08-22 UTC+2

اگست 20 2025 کو جی بی پی / یو ایس ڈی تجزیہ

جی بی پی / یو ایس ڈی کے لیے، ویوو کا ڈھانچہ اب بھی اوپر کی طرف آنے والے تسلسل کی ترقی کی نشاندہی کرتا ہے۔ ویوو کا نمونہ تقریباً

Chin Zhao 20:23 2025-08-20 UTC+2

اگست 25 2025 کو یورو / یو ایس ڈی تجزیہ

یورو / یو ایس ڈی کے 4 گھنٹے کے چارٹ پر لہر کا نمونہ اب کئی مہینوں سے غیر تبدیل شدہ ہے، جو کہ بہت حوصلہ افزا ہے۔ یہاں

Chin Zhao 20:17 2025-08-20 UTC+2

یورو / یو ایس ڈی کا تجزیہ برائے 12 اگست 2025

یورو / یو ایس ڈی کے 4 گھنٹے کے چارٹ پر لہر کا ڈھانچہ کئی مہینوں سے بدستور برقرار ہے، جو بہت حوصلہ افزا ہے۔ یہاں تک کہ جب اصلاحی

Chin Zhao 20:50 2025-08-12 UTC+2

جی بی پی / یو ایس ڈی کا تجزیہ برائے 12 اگست 2025

جی بی پی / یو ایس ڈی کے لیے، لہر کا ڈھانچہ بلش امپلس ویو پیٹرن کی تشکیل کی نشاندہی کرتا رہتا ہے۔ لہر کی تصویر تقریباً یورو

Chin Zhao 20:37 2025-08-12 UTC+2

یورو / یو ایس ڈی تجزیہ برائے 31 جولائی 2025

یورو / یو ایس ڈی کے لیے 4 گھنٹے کے چارٹ پر لہر کا نمونہ کئی مہینوں سے بدستور برقرار ہے۔ رجحان کا اوپر کی طرف حصہ بننا جاری ہے،

Chin Zhao 21:10 2025-07-31 UTC+2

جی بی پی / یو ایس ڈی کا تجزیہ برائے 31 جولائی 2025

جی بی پی / یو ایس ڈی کے لیے لہر کا نمونہ تیزی کے تسلسل کی لہر کے ڈھانچے کی ترقی کی نشاندہی کرتا ہے۔ لہر کی ترتیب یورو

Chin Zhao 21:05 2025-07-31 UTC+2

جولائی 29 کو یورو / یو ایس ڈی: بلز مارکیٹ کو 1.189 کی سطح کی طرف دھکیل سکتے ہیں

طویل مدت میں، یورو / یو ایس ڈی مارکیٹ ایک بڑی تیزی کی اصلاح (بی) تشکیل دے رہی ہے، جو معیاری اے بی سی زگ زیگ کی شکل اختیار

Roman Onegin 19:06 2025-07-29 UTC+2

یورو / یو ایس ڈی کا تجزیہ برائے 17 جولائی 2025

یورو / یو ایس ڈی کے لیے 4 گھنٹے کے چارٹ پر لہر کا پیٹرن مسلسل کئی مہینوں سے غیر تبدیل شدہ ہے۔ اوپر کی طرف رجحان والے

Chin Zhao 21:57 2025-07-16 UTC+2

جولائی 16 2025 کو جی بی پی / یو ایس ڈی تجزیہ

جی بی پی / یو ایس ڈی کے لیے لہر کا پیٹرن بلش امپلس ویو پیٹرن کی تشکیل کی نشاندہی کرتا ہے۔ لہر کی ترتیب تقریباً یورو

Chin Zhao 21:53 2025-07-16 UTC+2
ابھی فوری بات نہیں کرسکتے ؟
اپنا سوال پوچھیں بذریعہ چیٹ.
Widget callback
 

Dear visitor,

Your IP address shows that you are currently located in the USA. If you are a resident of the United States, you are prohibited from using the services of InstaFintech Group including online trading, online transfers, deposit/withdrawal of funds, etc.

If you think you are seeing this message by mistake and your location is not the US, kindly proceed to the website. Otherwise, you must leave the website in order to comply with government restrictions.

Why does your IP address show your location as the USA?

  • - you are using a VPN provided by a hosting company based in the United States;
  • - your IP does not have proper WHOIS records;
  • - an error occurred in the WHOIS geolocation database.

Please confirm whether you are a US resident or not by clicking the relevant button below. If you choose the wrong option, being a US resident, you will not be able to open an account with InstaForex anyway.

We are sorry for any inconvenience caused by this message.