signal strength 5 of 5

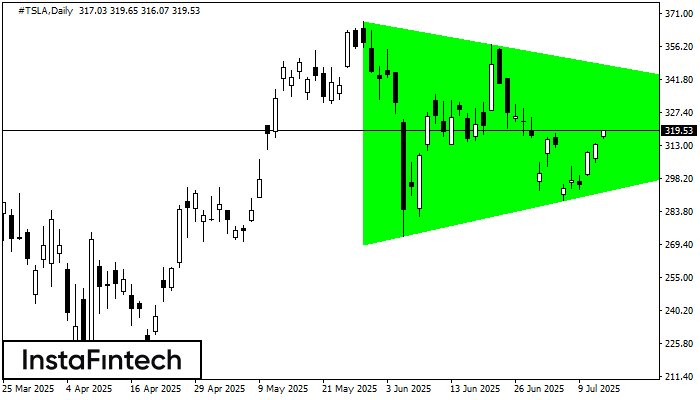
According to the chart of D1, #TSLA formed the Bullish Symmetrical Triangle pattern. Description: This is the pattern of a trend continuation. 367.40 and 269.16 are the coordinates of the upper and lower borders respectively. The pattern width is measured on the chart at 9824 pips. Outlook: If the upper border 367.40 is broken, the price is likely to continue its move by 323.66.
See Also
- All
- Double Top
- Flag
- Head and Shoulders
- Pennant
- Rectangle
- Triangle
- Triple top
- All
- #AAPL
- #AMZN
- #Bitcoin
- #EBAY
- #FB
- #GOOG
- #INTC
- #KO
- #MA
- #MCD
- #MSFT
- #NTDOY
- #PEP
- #TSLA
- #TWTR
- AUDCAD
- AUDCHF
- AUDJPY
- AUDUSD
- EURCAD
- EURCHF
- EURGBP
- EURJPY
- EURNZD
- EURRUB
- EURUSD
- GBPAUD
- GBPCHF
- GBPJPY
- GBPUSD
- GOLD
- NZDCAD
- NZDCHF
- NZDJPY
- NZDUSD
- SILVER
- USDCAD
- USDCHF
- USDJPY
- USDRUB
- All
- M5
- M15
- M30
- H1
- D1
- All
- Buy
- Sale
- All
- 1
- 2
- 3
- 4
- 5
The Double Bottom pattern has been formed on #PEP M5. This formation signals a reversal of the trend from downwards to upwards. The signal is that a buy trade should
The M5 and M15 time frames may have more false entry points.
Open chart in a new windowThe Double Bottom pattern has been formed on NZDCHF M5. This formation signals a reversal of the trend from downwards to upwards. The signal is that a buy trade should
The M5 and M15 time frames may have more false entry points.
Open chart in a new windowThe Bearish Flag pattern has been formed on the chart #NTDOY M5 which signals that the downward trend will continue. If the price breaks below the low at 23.17, then
The M5 and M15 time frames may have more false entry points.
Open chart in a new window