signal strength 1 of 5

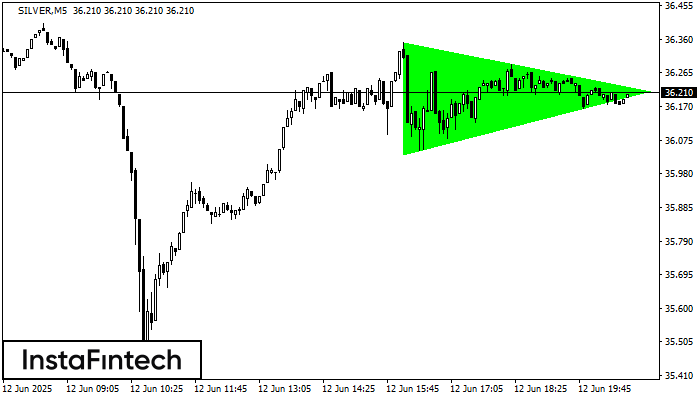
According to the chart of M5, SILVER formed the Bullish Symmetrical Triangle pattern. The lower border of the pattern touches the coordinates 36.03/36.21 whereas the upper border goes across 36.35/36.21. If the Bullish Symmetrical Triangle pattern is in progress, this evidently signals a further upward trend. In other words, in case the scenario comes true, the price of SILVER will breach the upper border to head for 36.23.
The M5 and M15 time frames may have more false entry points.
- All
- Double Top
- Flag
- Head and Shoulders
- Pennant
- Rectangle
- Triangle
- Triple top
- All
- #AAPL
- #AMZN
- #Bitcoin
- #EBAY
- #FB
- #GOOG
- #INTC
- #KO
- #MA
- #MCD
- #MSFT
- #NTDOY
- #PEP
- #TSLA
- #TWTR
- AUDCAD
- AUDCHF
- AUDJPY
- AUDUSD
- EURCAD
- EURCHF
- EURGBP
- EURJPY
- EURNZD
- EURRUB
- EURUSD
- GBPAUD
- GBPCHF
- GBPJPY
- GBPUSD
- GOLD
- NZDCAD
- NZDCHF
- NZDJPY
- NZDUSD
- SILVER
- USDCAD
- USDCHF
- USDJPY
- USDRUB
- All
- M5
- M15
- M30
- H1
- D1
- All
- Buy
- Sale
- All
- 1
- 2
- 3
- 4
- 5
On the chart of NZDUSD M15 the Double Top reversal pattern has been formed. Characteristics: the upper boundary 0.6089; the lower boundary 0.6077; the width of the pattern 12 points
The M5 and M15 time frames may have more false entry points.
Open chart in a new windowThe Bearish pennant pattern has formed on the EURNZD M5 chart. The pattern signals continuation of the downtrend in case the pennant’s low of 1.9357 is broken through. Recommendations: Place
The M5 and M15 time frames may have more false entry points.
Open chart in a new windowThe Triple Top pattern has formed on the chart of the #Bitcoin M15. Features of the pattern: borders have an ascending angle; the lower line of the pattern
The M5 and M15 time frames may have more false entry points.
Open chart in a new window