empty
сформирован 23.04 в 17:30:02 (UTC+0)
сила сигнала 2 из 5
Тройная вершина #MCD M15

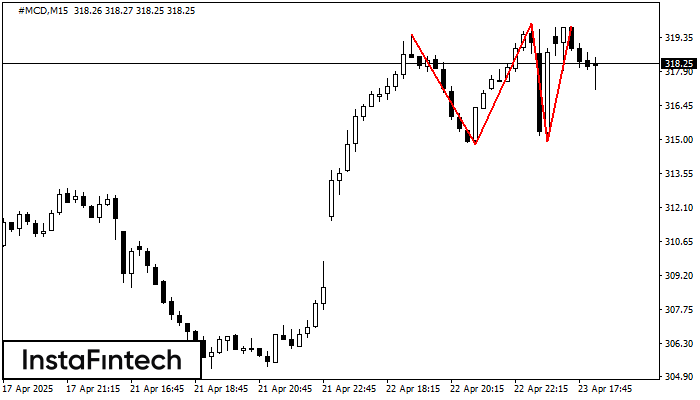
По #MCD на M15 сформировалась фигура «Тройная вершина». Характеристика: Границы имеют восходящий угол. Нижняя граница фигуры имеет координаты 314.80/314.94, при этом верхняя граница 319.49/319.82. Проекция ширины 469 пунктов. Формирование фигуры «Тройная вершина» наиболее вероятным образом свидетельствует об изменении тренда с восходящего на нисходящий. Это означает, что, в случае пробоя нижней границы 314.94, курс, с наибольшей вероятностью, продолжит нисходящее движение.

Таймфреймы М5 и М15 могут иметь больше ложных точек входа.

Шунингдек кўринг

Фигура
  • Все
  • Вымпел
  • Голова и плечи
  • Двойная вершина
  • Прямоугольник
  • Треугольник
  • Тройная вершина
  • Флаг
Инструмент
  • Все
  • #AAPL
  • #AMZN
  • #Bitcoin
  • #EBAY
  • #FB
  • #GOOG
  • #INTC
  • #KO
  • #MA
  • #MCD
  • #MSFT
  • #NTDOY
  • #PEP
  • #TSLA
  • #TWTR
  • AUDCAD
  • AUDCHF
  • AUDJPY
  • AUDUSD
  • EURCAD
  • EURCHF
  • EURGBP
  • EURJPY
  • EURNZD
  • EURRUB
  • EURUSD
  • GBPAUD
  • GBPCHF
  • GBPJPY
  • GBPUSD
  • GOLD
  • NZDCAD
  • NZDCHF
  • NZDJPY
  • NZDUSD
  • SILVER
  • USDCAD
  • USDCHF
  • USDJPY
  • USDRUB
Таймфрейм
  • Все
  • M5
  • M15
  • M30
  • H1
  • D1
Тренд
  • Все
  • Покупка
  • Продажа
Сила сигнала
  • Все
  • 1
  • 2
  • 3
  • 4
  • 5
Double Top
was formed on 22.05 at 21:05:25 (UTC+0)
signal strength 1 of 5
Double Top #Bitcoin M5

The Double Top reversal pattern has been formed on #Bitcoin M5. Characteristics: the upper boundary 111951.72; the lower boundary 111327.72; the width of the pattern is 59233 points. Sell trades

The M5 and M15 time frames may have more false entry points.

Open chart in a new window
Bullish Rectangle
was formed on 22.05 at 20:52:50 (UTC+0)
signal strength 1 of 5
Bullish Rectangle #AAPL M5

According to the chart of M5, #AAPL formed the Bullish Rectangle which is a pattern of a trend continuation. The pattern is contained within the following borders: the lower border

The M5 and M15 time frames may have more false entry points.

Open chart in a new window
Triple Bottom
was formed on 22.05 at 20:50:14 (UTC+0)
signal strength 1 of 5
Triple Bottom NZDCAD M5

The Triple Bottom pattern has formed on the chart of NZDCAD M5. Features of the pattern: The lower line of the pattern has coordinates 0.8185 with the upper limit 0.8185/0.8179

The M5 and M15 time frames may have more false entry points.

Open chart in a new window
Ҳозир телефон орқали гаплаша олмайсизми?
Саволингизни беринг чатда.
Обратный звонок
 

Dear visitor,

Your IP address shows that you are currently located in the USA. If you are a resident of the United States, you are prohibited from using the services of InstaFintech Group including online trading, online transfers, deposit/withdrawal of funds, etc.

If you think you are seeing this message by mistake and your location is not the US, kindly proceed to the website. Otherwise, you must leave the website in order to comply with government restrictions.

Why does your IP address show your location as the USA?

  • - you are using a VPN provided by a hosting company based in the United States;
  • - your IP does not have proper WHOIS records;
  • - an error occurred in the WHOIS geolocation database.

Please confirm whether you are a US resident or not by clicking the relevant button below. If you choose the wrong option, being a US resident, you will not be able to open an account with InstaForex anyway.

We are sorry for any inconvenience caused by this message.