

signal strength 1 of 5
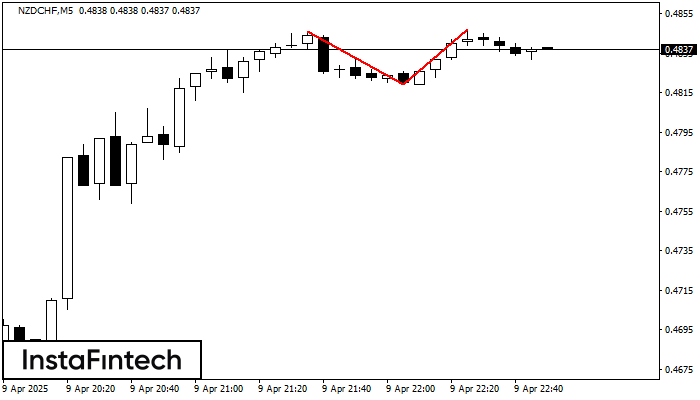
The Double Top pattern has been formed on NZDCHF M5. It signals that the trend has been changed from upwards to downwards. Probably, if the base of the pattern 0.4819 is broken, the downward movement will continue.
The M5 and M15 time frames may have more false entry points.
- All
- Double Top
- Flag
- Head and Shoulders
- Pennant
- Rectangle
- Triangle
- Triple top
- All
- #AAPL
- #AMZN
- #Bitcoin
- #EBAY
- #FB
- #GOOG
- #INTC
- #KO
- #MA
- #MCD
- #MSFT
- #NTDOY
- #PEP
- #TSLA
- #TWTR
- AUDCAD
- AUDCHF
- AUDJPY
- AUDUSD
- EURCAD
- EURCHF
- EURGBP
- EURJPY
- EURNZD
- EURRUB
- EURUSD
- GBPAUD
- GBPCHF
- GBPJPY
- GBPUSD
- GOLD
- NZDCAD
- NZDCHF
- NZDJPY
- NZDUSD
- SILVER
- USDCAD
- USDCHF
- USDJPY
- USDRUB
- All
- M5
- M15
- M30
- H1
- D1
- All
- Buy
- Sale
- All
- 1
- 2
- 3
- 4
- 5
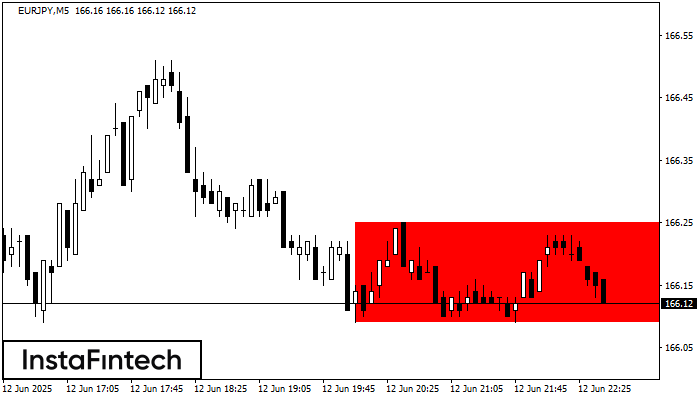
Berdasarkan carta M5, EURJPY telah membentuk Segi Empat Menurun. Corak ini menunjukkan kesinambungan aliran. Sempadan atas adalah 166.25, sempadan bawah adalah 166.09. Isyarat bermakna bahawa kedudukan pendek perlu dibuka selepas
Carta masa M5 dan M15 mungkin mempunyai lebih banyak titik kemasukan palsu.
Open chart in a new window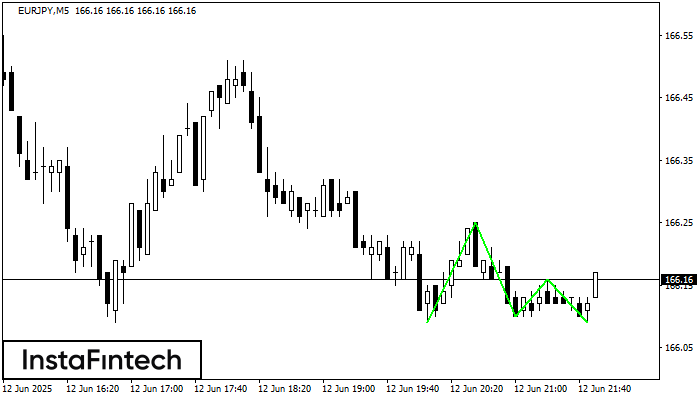
Corak Triple Bottom telah dibentuk pada EURJPY M5. Ia mempunyai ciri-ciri berikut: tahap rintangan 166.25/166.16; tahap sokongan 166.09/166.09; lebar corak adalah 16 mata. Dalam situasi penembusan paras rintangan 166.25, harga
Carta masa M5 dan M15 mungkin mempunyai lebih banyak titik kemasukan palsu.
Open chart in a new window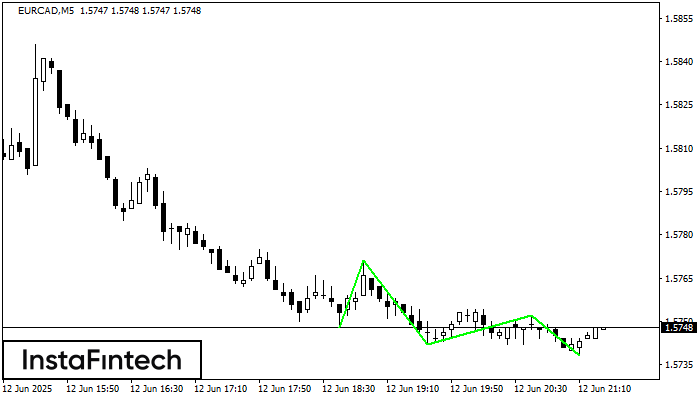
Corak Triple Bottom telah dibentuk pada EURCAD M5. Ia mempunyai ciri-ciri berikut: tahap rintangan 1.5771/1.5752; tahap sokongan 1.5748/1.5738; lebar corak adalah 23 mata. Dalam situasi penembusan paras rintangan 1.5771, harga
Carta masa M5 dan M15 mungkin mempunyai lebih banyak titik kemasukan palsu.
Open chart in a new window


