empty
10.07.2025 10:35 AM
Forecast for GBP/USD on July 10, 2025

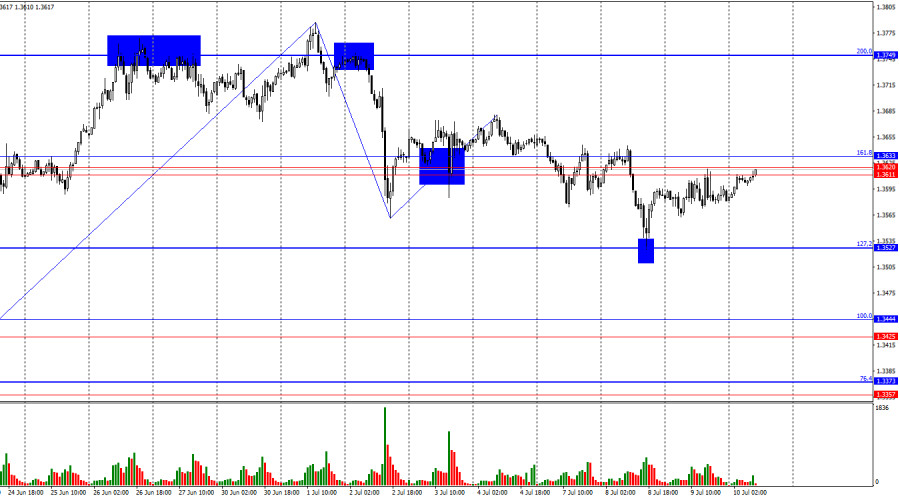
On the hourly chart, the GBP/USD pair continued its upward movement on Wednesday after rebounding from the 127.2% Fibonacci corrective level at 1.3527. The rebound was precise, leading to a reversal in favor of the British pound and a return to the resistance level of 1.3611–1.3633. I am fairly confident that this level will be broken in the near future—possibly even today. This week's information background makes it extremely difficult for the dollar to maintain its recent upward momentum. A close above the 1.3611–1.3633 level would allow for a continuation of the rise toward the next 200.0% Fibonacci level at 1.3749.

This image is no longer relevant

The wave structure also suggests a continued bullish trend. The last completed upward wave broke the previous high, while the two subsequent downward waves failed to form a lower low. This indicates not a trend reversal but a corrective wave sequence. Bearish traders still lack sufficient grounds to establish a trend of their own, and the dollar currently has very little fundamental support. Trump's trade war continues to negatively affect the U.S. currency.

On Monday, Tuesday, and Wednesday, U.S. President Donald Trump was highly active—announcing new tariffs, raising existing ones, threatening all trading partners, and once again criticizing Jerome Powell. Trump called Powell "slow," lamented low inflation in the U.S., and expressed confusion over the FOMC's reluctance to cut interest rates. According to Trump, many companies are returning to the U.S. or planning to start businesses there. Inflation remains low, yet each percentage point of the Fed's rate costs America 360 billion dollars per year. Trump believes the current rate should be 3% lower. However, the FOMC remains calm and does not intend to yield to presidential pressure. Powell argues that inflation will rise and that any conclusions about a slowdown in the economy or inflation growth can only be made once the final trade tariffs are known. So far this week, Trump has revised or imposed new tariffs three times. At this point, even attempting to forecast economic indicators seems pointless.

This image is no longer relevant

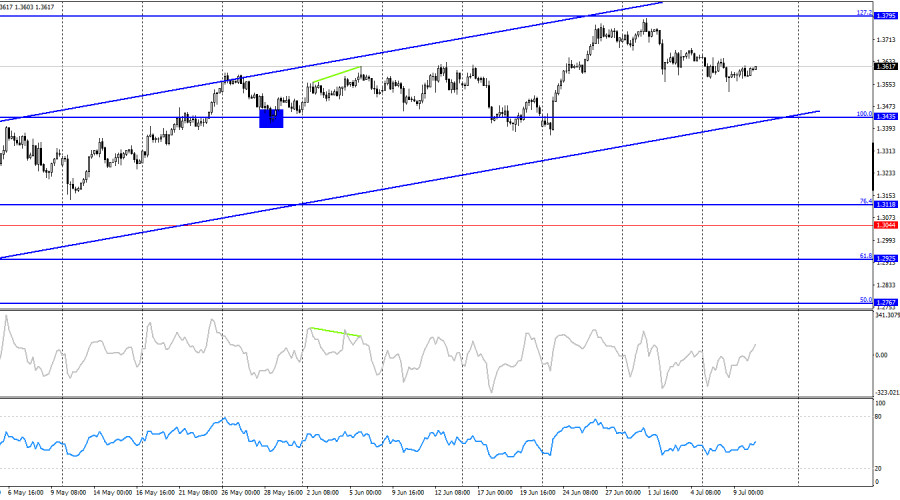
On the 4-hour chart, the pair reversed in favor of the U.S. dollar just a few points short of the 127.2% Fibonacci correction level at 1.3795. Since the drop was unexpected and may end quickly, it is more appropriate to focus on the hourly chart for now. No forming divergences are observed on any indicator. The bullish trend remains intact.

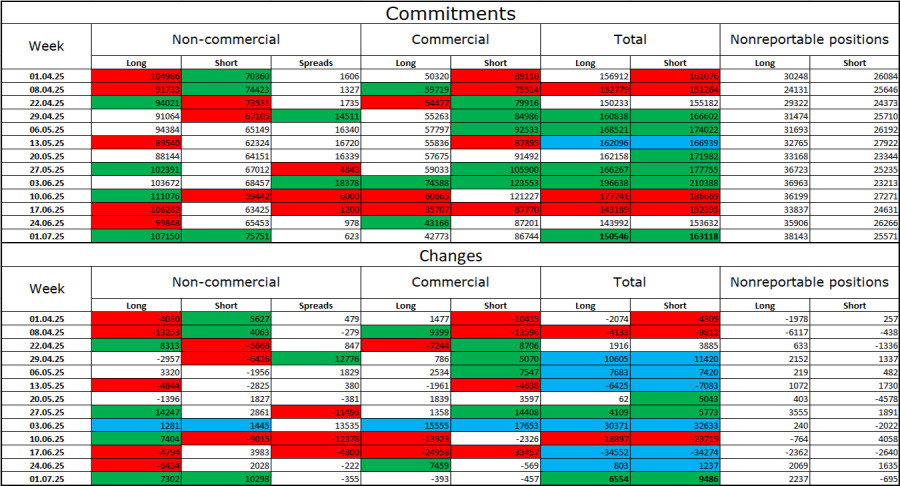
Commitments of Traders (COT) Report:

This image is no longer relevant

The sentiment of the "Non-commercial" trader category became slightly less bullish in the latest reporting week. The number of long positions held by speculators increased by 7,302, while the number of short positions rose by 10,298. However, bears have long lost their advantage and currently have no realistic chance of success. The gap between long and short positions stands at 32,000 in favor of the bulls: 107,000 vs. 75,000.

In my view, while there may still be downward potential for the British pound, events in 2025 have significantly changed the market's long-term direction. Over the past four months, the number of long positions has increased from 65,000 to 107,000, while shorts have declined from 76,000 to 75,000. Under Donald Trump, confidence in the dollar has weakened, and the COT reports indicate that traders lack the appetite to buy it. Therefore, regardless of the general news background, the dollar continues to decline due to developments surrounding Donald Trump.

News calendar for the U.S. and the UK:

U.S. – Initial jobless claims (12:30 UTC).

On Thursday, the economic calendar contains no significant entries. As a result, the news background will have little to no influence on market sentiment today.

GBP/USD Forecast and Trading Recommendations:

Selling opportunities may arise today if the pair bounces from the 1.3611–1.3633 zone, with a target at 1.3527. Buying opportunities open up if the pair closes above the 1.3611–1.3633 zone on the hourly chart, targeting 1.3749. It was also possible to buy following the rebound from the 1.3527 level.

Fibonacci level grids were built using 1.3446–1.3139 on the hourly chart and 1.3431–1.2104 on the 4-hour chart.

Samir Klishi,
Analytical expert of InstaForex
© 2007-2025
Summary
Urgency
Analytic
Grigory Sokolov
Start trade
Earn on cryptocurrency rate changes with InstaForex
Download MetaTrader 4 and open your first trade
  • Grand Choice
    Contest by
    InstaForex
    InstaForex always strives to help you
    fulfill your biggest dreams.
    JOIN CONTEST

Recommended Stories

Crude Oil has the potential to strengthen today, rising towards its nearest resistance level. Tuesday, September 02, 2025.

[Crude Oil] – [Tuesday, September 02, 2025] With the EMA (50) condition above the EMA (200) and the RSI in the neutral-bullish area, there is potential for #CL to strengthen

Arief Makmur 07:01 2025-09-02 UTC+2

As long as it doesn't break through and close above 98.00, the #DXY has the potential to weaken today. Tuesday, September 02, 2025.

[USDX] – [Tuesday, 02 September 2025] Although the RSI is in the Neutral Bullish area, with the two EMAs position crossing the Death Cross, as long as it doesn't break

Arief Makmur 07:01 2025-09-02 UTC+2

Forex forecast 01/09/2025: EUR/USD, GBP/USD, USD/JPY, Gold and Bitcoin

Useful links: My other articles are available in this section InstaForex course for beginners Popular Analytics Open trading account Important: The begginers in forex trading need to be very careful

Sebastian Seliga 15:13 2025-09-01 UTC+2

EUR/USD. September 1st. The Week Begins with Lagarde's Speech

On Friday, the EUR/USD pair continued its upward movement and, on the third attempt, consolidated above the 76.4% Fibonacci correction level – 1.1695. Thus, growth may continue on Monday toward

Samir Klishi 12:17 2025-09-01 UTC+2

Forecast for GBP/USD on September 1, 2025

On the hourly chart, the GBP/USD pair on Friday fell below the 76.4% Fibonacci level – 1.3482, but then reversed in favor of the pound and began a new upward

Samir Klishi 11:52 2025-09-01 UTC+2

GBP/USD. Technical Analysis for September 2025

In August, the pair, moving upward, tested the historical resistance level at 1.3579 (blue dotted line) and then pulled back slightly, closing the monthly candle at 1.3502. In September

Stefan Doll 11:15 2025-09-01 UTC+2

Will XAU/USD (Gold) continue its strengthening today? Monday, September 01, 2025.

[XAU/USD (Gold)] – [Monday, September 01, 2025] Gold is highly likely to continue its strengthening today, as it is confirmed by the both of EMAs crossing a Golden Cross

Arief Makmur 10:13 2025-09-01 UTC+2

The Loonie is testing its Pivot Resistance. If it fails to break through, then it has the potential to continue the decline. Monday, September 01, 2025.

[USD/CAD] – [Monday, September 01, 2025] With the EMA(50) condition below the EMA(200) as well as the RSI at a neutral bearish levels, it has the potential to continue

Arief Makmur 10:13 2025-09-01 UTC+2

EUR/USD. Technical Analysis for September 2025

In August, the pair, moving upward, tested the historical resistance level of 1.1710 (blue dotted line) and then pulled back slightly, closing the monthly candle at 1.1685. In September

Stefan Doll 09:53 2025-09-01 UTC+2

GBP/USD. Technical Analysis for the Week of September 1–6

Last week, the pair moved downward, tested the 21-period simple moving average at 1.3428 (black dotted line), and then turned upward, closing the weekly candle at 1.3502. In the upcoming

Stefan Doll 09:50 2025-09-01 UTC+2
Can't speak right now?
Ask your question in the chat.
Widget callback
 

Dear visitor,

Your IP address shows that you are currently located in the USA. If you are a resident of the United States, you are prohibited from using the services of InstaFintech Group including online trading, online transfers, deposit/withdrawal of funds, etc.

If you think you are seeing this message by mistake and your location is not the US, kindly proceed to the website. Otherwise, you must leave the website in order to comply with government restrictions.

Why does your IP address show your location as the USA?

  • - you are using a VPN provided by a hosting company based in the United States;
  • - your IP does not have proper WHOIS records;
  • - an error occurred in the WHOIS geolocation database.

Please confirm whether you are a US resident or not by clicking the relevant button below. If you choose the wrong option, being a US resident, you will not be able to open an account with InstaForex anyway.

We are sorry for any inconvenience caused by this message.