empty
02.04.2025 12:17 PM
BTC/USD Analysis. April 2nd. Bitcoin Is Also Afraid of Trump's Tariffs

This image is no longer relevant

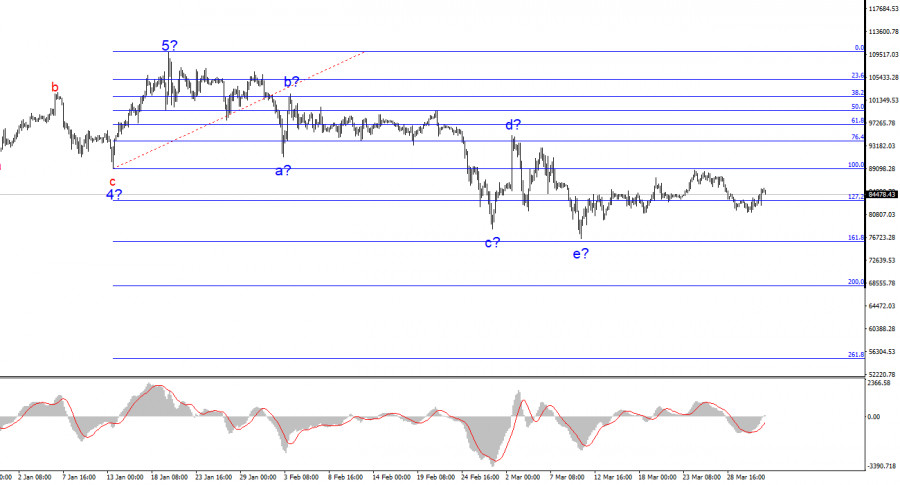
The wave pattern on the 4-hour BTC/USD chart is clear. After completing a bullish trend composed of five full waves, a downward corrective phase began, which is still in progress. Based on this, I did not—and still do not—expect Bitcoin to rise above $110,000–$115,000 in the coming months.

The news backdrop had been supporting Bitcoin thanks to a steady flow of headlines about new investments from institutional traders, various governments, and pension funds. However, Trump and his policies have caused investors to exit the market—no trend can rise indefinitely. The wave that began on January 20 does not resemble an impulsive one. Thus, we are dealing with a complex corrective structure that could take months to form. Internally, this first wave is quite intricate, but a five-wave a-b-c-d-e structure within it can be distinguished. If the current wave count is correct, we are now seeing the formation of an upward corrective wave, which in classical theory consists of three waves. Waves a and b appear to be complete.

The BTC/USD rate has stabilized, and the current wave count suggests further upward movement. But how strong might this growth be? Many in the market panic if Bitcoin drops by $10,000–$15,000. However, given Bitcoin's extreme volatility, such a move can occur in just a few days. The price fell $33,000 from its all-time high—and even that correction doesn't seem excessive enough to expect a fresh bullish trend.

Therefore, I anticipate a corrective wave or series of waves, after which the broader corrective structure will continue to develop.

At the moment, Bitcoin is consolidating, and the market is waiting. Some might view a drop to $80,000 as sufficient—but let me remind you of the period from November 2021 to November 2022, when Bitcoin fell from $69,000 to $16,000. Back then, economists and crypto analysts also predicted continued growth and a target of $100,000, but Bitcoin lost nearly 80% of its value. Why couldn't a similar scenario unfold now?

That previous decline lasted a full year. This one has been unfolding for only 2.5 months. Trump may announce new global tariffs as soon as today, and under Donald Trump, Bitcoin tends to fall. It's quite symbolic that the decline began on January 20—Trump's inauguration day.

Given the above and the current wave structure, I believe the downtrend will continue.

This image is no longer relevant

General Conclusions

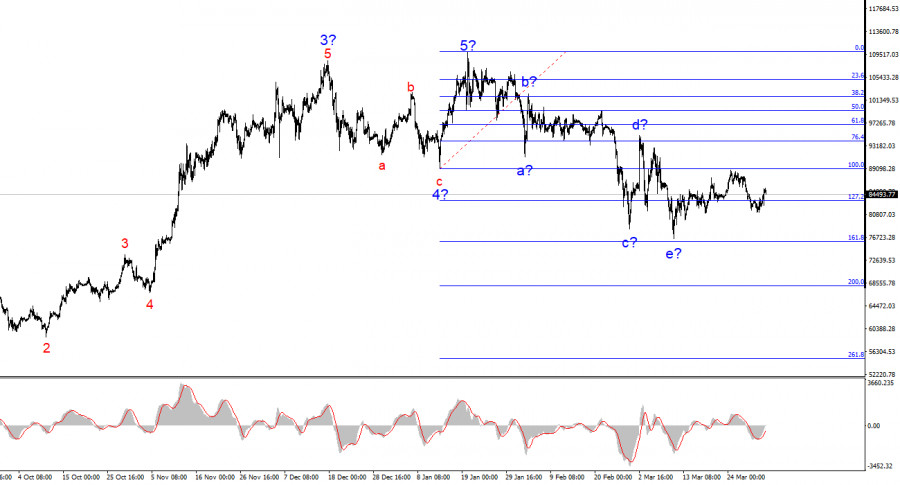
Based on the BTC/USD analysis, I conclude that the current growth phase is over. All signs point toward a complex, multi-month correction. That's why I have previously advised against buying crypto—and now, even more so. A drop below the low of wave 4 indicates a transition into a downward trend phase, most likely of a corrective nature.

In this context, the best strategy is to look for selling opportunities. A short-term upward corrective wave may occur soon, during which new short positions can be considered with targets near $68,000 and possibly as low as $55,000.

Higher Timeframe Outlook

On the higher wave scale, a five-wave bullish structure is visible. We are now witnessing the beginning of a corrective or bearish wave structure, potentially marking a new downtrend.

Core Principles of My Analysis:

  1. Wave structures should be simple and understandable. Complex formations are difficult to trade and often lead to revisions.
  2. If there's no confidence in the market situation, it's better to stay out.Absolute certainty in market direction is never possible. Always use Stop Loss orders.
  3. Wave analysis can be combined with other forms of analysis and trading strategies.
Chin Zhao,
Analytical expert of InstaForex
© 2007-2025
Select timeframe
5
min
15
min
30
min
1
hour
4
hours
1
day
1
week
Earn on cryptocurrency rate changes with InstaForex
Download MetaTrader 4 and open your first trade
  • Grand Choice
    Contest by
    InstaForex
    InstaForex always strives to help you
    fulfill your biggest dreams.
    JOIN CONTEST

Recommended Stories

Bitcoin. May 23rd. Smart Money System Analysis

Bitcoin continues to form a bullish trend structure. One could argue whether there are real reasons for a new bullish trend at the moment, but the chart suggests only that—unambiguously

Samir Klishi 20:04 2025-05-23 UTC+2

TRUMP official: crypto community, protests, and politics

On the evening of May 22, 2025, a unique event took place at the Trump National Golf Club in Virginia — a dinner hosted by Donald Trump with the largest

Jurij Tolin 16:49 2025-05-23 UTC+2

Technical Analysis of Intraday Price Movement of Doge Cryptocurrency, Friday May 23, 2025.

It appears that the price movement of the Doge Cryptocurrency on the 4-hour chart is moving above the WMA (21) which has a slope that is going upwards

Arief Makmur 09:04 2025-05-23 UTC+2

Technical Analysis of Intraday Price Movement of Ripple Cryptocurrency, Friday May 23, 2025.

If we look at the 4-hour chart of the Ripple cryptocurrency, it appears to be moving above the WMA (21) which has a steep slope and has successfully broken

Arief Makmur 09:04 2025-05-23 UTC+2

Bitcoin Forecast for May 23, 2025

On Thursday, Bitcoin's price reached the target level of 111,770. The Marlin oscillator appears to be lagging behind the price, giving the impression of a potential divergence — though unconventional

Laurie Bailey 04:45 2025-05-23 UTC+2

Bitcoin aims to hit $120,000? What lies behind its rally and when to expect retracement

On May 22, Bitcoin confidently broke through the $111,888 level, setting a new all-time high of $111,867. Unlike previous rallies marked by retail investor euphoria, this time the market's behavior

Ekaterina Kiseleva 16:12 2025-05-22 UTC+2

Bitcoin extending confident rally

Bitcoin demand appears to be surging, judging by its recent performance. At the time of publication, the BTC/USD pair was trading near 111,200.00, slightly down from today's and the all-time

Jurij Tolin 16:02 2025-05-22 UTC+2

Bitcoin: $115,000 — Next Stop or Bull Trap?

Bitcoin is steadily approaching its all-time high and, according to several analysts, is poised to set a new record. Current levels near $105,000 are more than just numbers — they

Ekaterina Kiseleva 00:58 2025-05-21 UTC+2

BTC/USD Analysis on May 20, 2025

The wave pattern on the 4-hour chart for BTC/USD has been becoming more complex in recent months. We observed a corrective downward structure, which completed its formation around the 75,000

Chin Zhao 11:11 2025-05-20 UTC+2

Technical Analysis of Daily Price Movement of Ethereum Cryptocurrency, Friday May 16, 2025.

If we look at the 4-hour chart, the Ethereum cryptocurrency appears to be moving above the WMA (21) which is a dynamic support where the WMA has a slope that

Arief Makmur 06:09 2025-05-16 UTC+2
Can't speak right now?
Ask your question in the chat.
Widget callback
 

Dear visitor,

Your IP address shows that you are currently located in the USA. If you are a resident of the United States, you are prohibited from using the services of InstaFintech Group including online trading, online transfers, deposit/withdrawal of funds, etc.

If you think you are seeing this message by mistake and your location is not the US, kindly proceed to the website. Otherwise, you must leave the website in order to comply with government restrictions.

Why does your IP address show your location as the USA?

  • - you are using a VPN provided by a hosting company based in the United States;
  • - your IP does not have proper WHOIS records;
  • - an error occurred in the WHOIS geolocation database.

Please confirm whether you are a US resident or not by clicking the relevant button below. If you choose the wrong option, being a US resident, you will not be able to open an account with InstaForex anyway.

We are sorry for any inconvenience caused by this message.