


was formed on 24.04 at 15:31:10 (UTC+0)
signal strength 1 of 5
signal strength 1 of 5
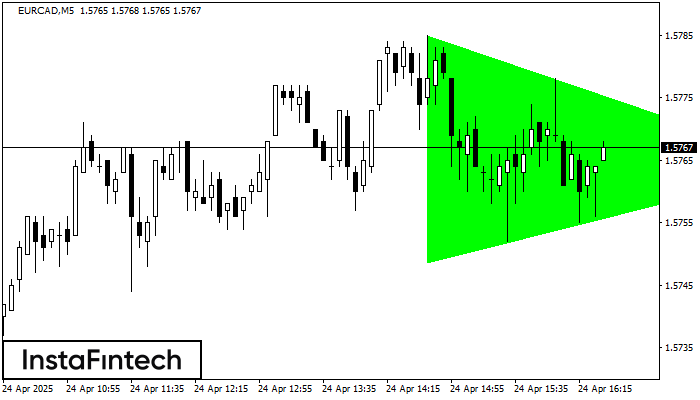
According to the chart of M5, EURCAD formed the Bullish Symmetrical Triangle pattern, which signals the trend will continue. Description. The upper border of the pattern touches the coordinates 1.5785/1.5764 whereas the lower border goes across 1.5749/1.5764. The pattern width is measured on the chart at 36 pips. If the Bullish Symmetrical Triangle pattern is in progress during the upward trend, this indicates the current trend will go on. In case 1.5764 is broken, the price could continue its move toward 1.5779.
The M5 and M15 time frames may have more false entry points.
Figure
- All
- Double Top
- Flag
- Head and Shoulders
- Pennant
- Rectangle
- Triangle
- Triple top
Instrument
- All
- #AAPL
- #AMZN
- #Bitcoin
- #EBAY
- #FB
- #GOOG
- #INTC
- #KO
- #MA
- #MCD
- #MSFT
- #NTDOY
- #PEP
- #TSLA
- #TWTR
- AUDCAD
- AUDCHF
- AUDJPY
- AUDUSD
- EURCAD
- EURCHF
- EURGBP
- EURJPY
- EURNZD
- EURRUB
- EURUSD
- GBPAUD
- GBPCHF
- GBPJPY
- GBPUSD
- GOLD
- NZDCAD
- NZDCHF
- NZDJPY
- NZDUSD
- SILVER
- USDCAD
- USDCHF
- USDJPY
- USDRUB
Timeframe
- All
- M5
- M15
- M30
- H1
- D1
Trend
- All
- Buy
- Sale
Signal Strength
- All
- 1
- 2
- 3
- 4
- 5


